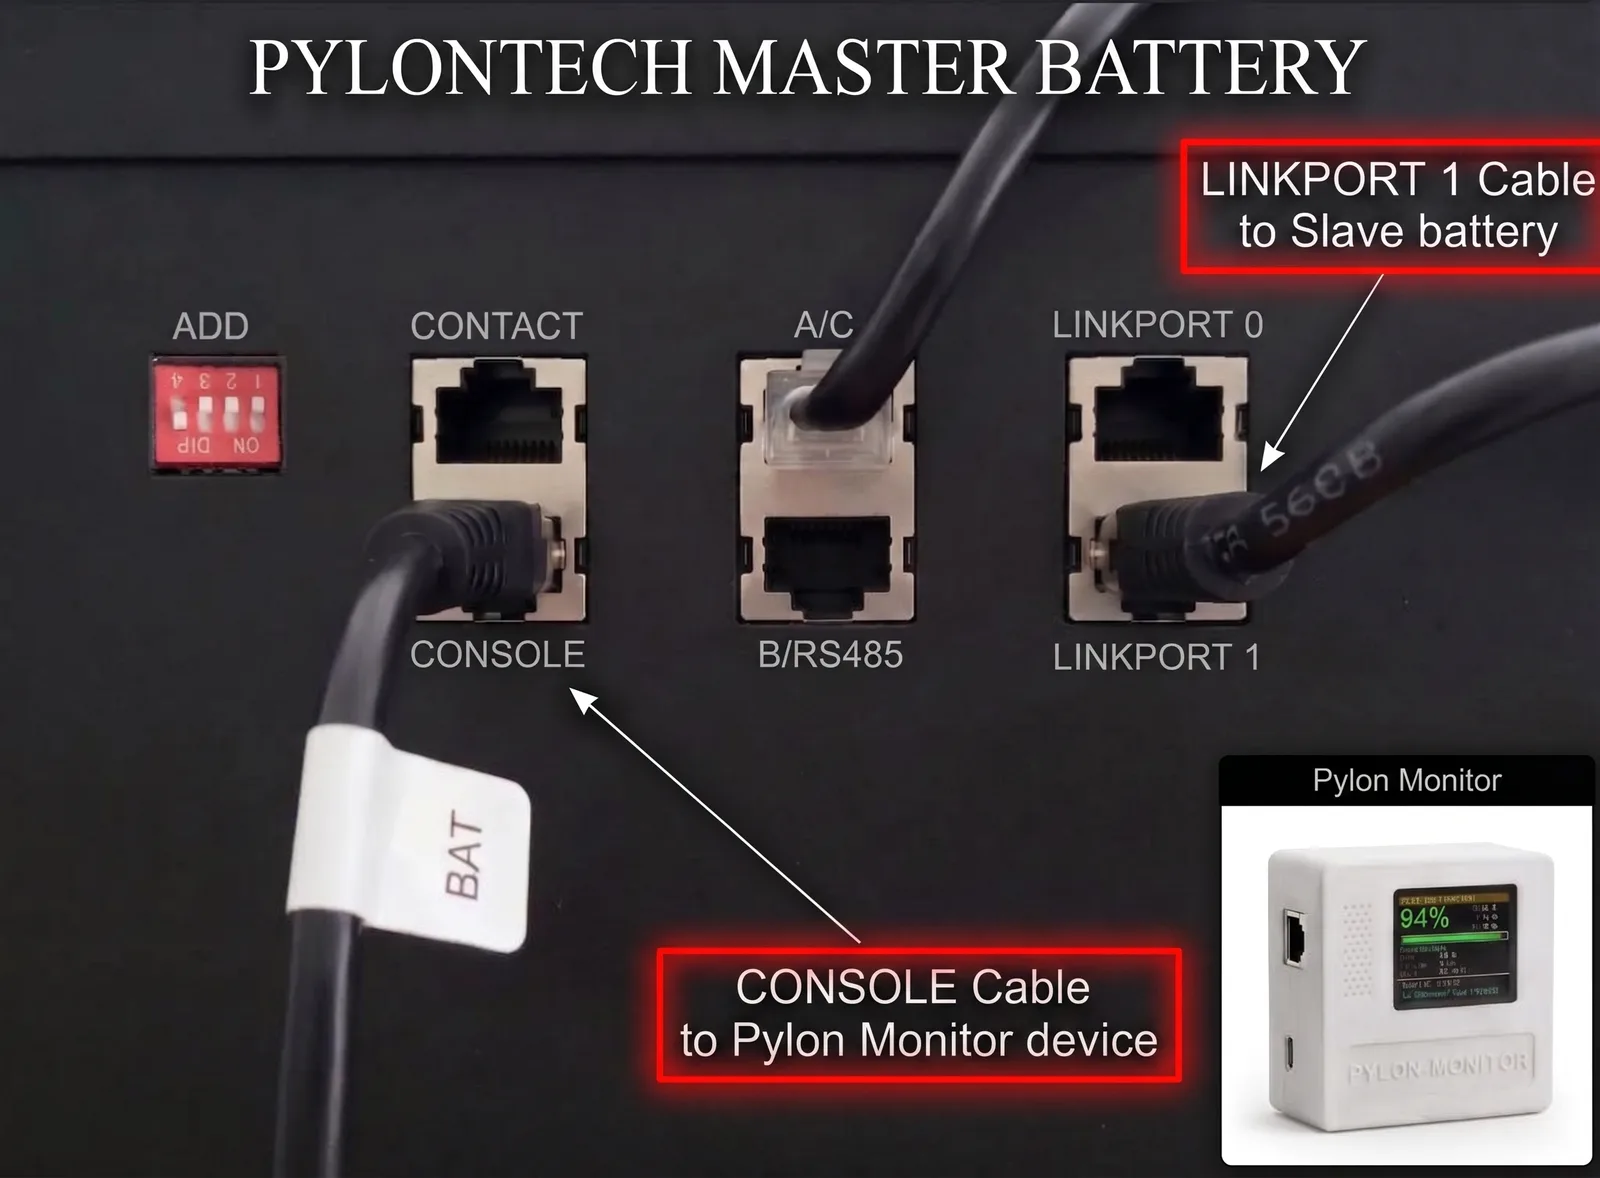
The cable that chains your master battery to the first slave must leave LINK PORT 1 on the master — never LINK PORT 0. It plugs into LINK PORT 0 on the slave, and every further battery repeats the same 1 → 0 pattern. Wired the other way round the master never sees the rest of the stack, so Pylon-Monitor reports a single battery no matter how many you own.
Choose your integration
Open the device Settings page (http://<DEVICE-IP>/settings). Both options are configured from there. Pick one — they are independent and can be enabled/disabled separately.
MQTT auto-discovery
You already run a Mosquitto / MQTT broker in Home Assistant. The Pylon-Monitor publishes its own discovery configs and Home Assistant creates the sensors automatically. No YAML.
Configure Option 1 ↓REST API polling
No broker required. Home Assistant polls the built-in JSON endpoint /api.json directly. Paste the YAML once — the device's Settings page actually generates it for you, with your IP already filled in.
<DEVICE-IP> as a placeholder — replace it with the IP shown on the TFT screen. To keep the integration stable, either set a DHCP reservation in your router (recommended) or fill in the Static IP section on the device Settings page.
Option 1 — MQTT auto-discovery
Recommended if you already use the Mosquitto / MQTT broker add-on in Home Assistant. Once the broker connection is set, the device publishes Home Assistant discovery configs to standard homeassistant/sensor/… topics, and sensors appear in Settings → Devices & Services → MQTT within a few seconds — grouped under a single device named Pylon-Monitor.
What you fill in on the device
On the device Settings page, open the MQTT Home Assistant card and fill these four fields exactly as the firmware expects them:
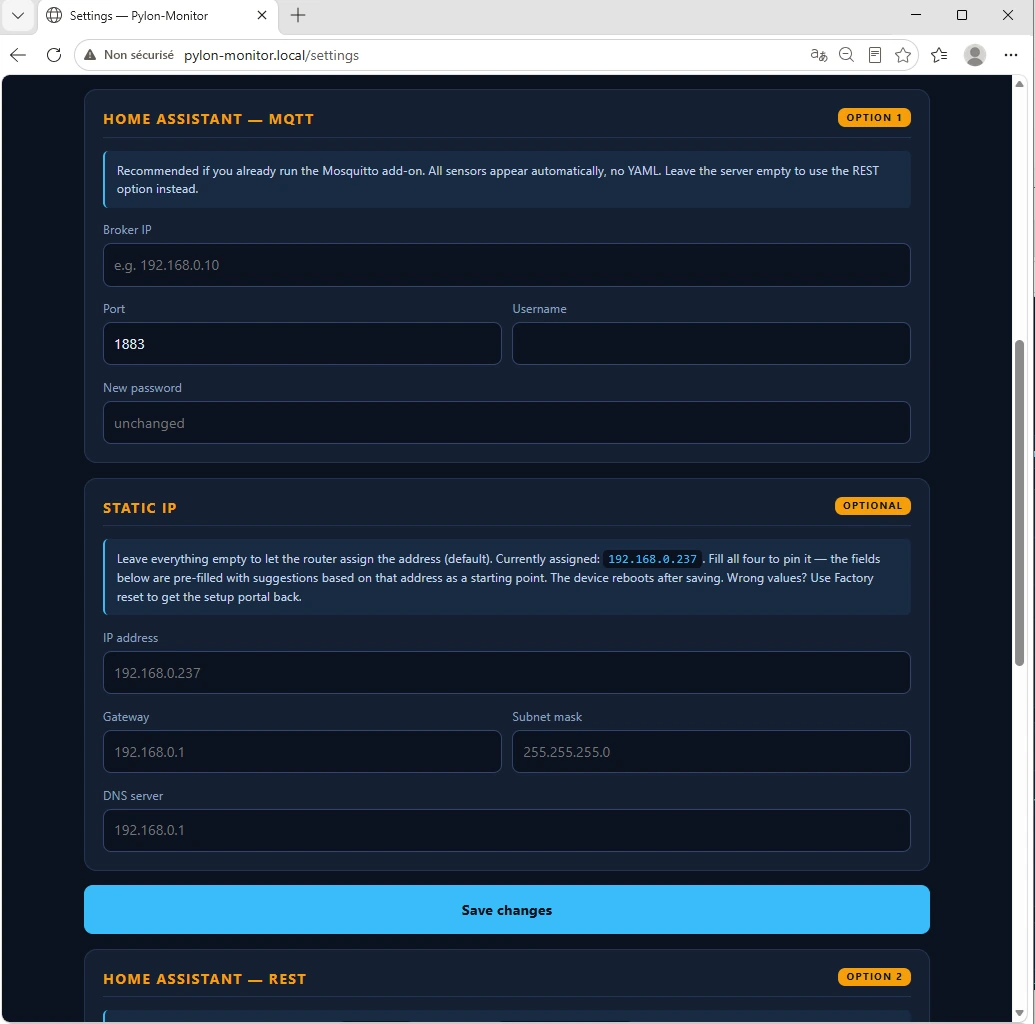
Save. The Pylon-Monitor's dashboard MQTT row turns blue (Connected) within ~5 seconds, and the ten sensors below are published automatically — no manual entity configuration. To disable MQTT, simply clear the four fields and save.
Topics the firmware publishes
The device hostname (default pylon-monitor) is used as the topic prefix and discovery node id. Replace it below with the hostname you chose. All ten sensors are grouped under one Home Assistant device card named Pylon-Monitor.
| Sensor | Discovery config topic | Unit / class |
|---|---|---|
| Battery SOC | homeassistant/sensor/pylon-monitor/soc/config | % · battery |
| Battery SOH | homeassistant/sensor/pylon-monitor/soh/config | % · mdi:battery-heart-variant |
| Battery voltage | homeassistant/sensor/pylon-monitor/voltage/config | V · voltage |
| Battery current | homeassistant/sensor/pylon-monitor/current/config | A · current |
| Battery power | homeassistant/sensor/pylon-monitor/power/config | W · power |
| Battery temp | homeassistant/sensor/pylon-monitor/temp/config | °C · temperature |
| MOSFET temp | homeassistant/sensor/pylon-monitor/mostemp/config | °C · temperature |
| Charge cycles | homeassistant/sensor/pylon-monitor/cycles/config | mdi:counter |
| Battery state | homeassistant/sensor/pylon-monitor/state/config | mdi:battery-sync |
| Cell imbalance | homeassistant/sensor/pylon-monitor/celldelta/config | mV · mdi:scale-balance |
All ten sensors share a single state topic from which they pull their values:
pylon-monitor/stateIf your pack has more than one Pylontech battery, five more sensors are published per additional unit — SOC, SOH, cycles, voltage and state — each on its own topic (<hostname>/battery2/state, <hostname>/battery3/state, …) so you can track an aging battery separately from the rest of the pack.
The payload, refreshed roughly every 40 seconds (one full battery poll cycle), looks like this:
{
  "soc": 94,
  "soh": 96,
  "voltage": 48.62,
  "current": -7.20,
  "power": -350.1,
  "temp": 23.4,
  "mostemp": 28.1,
  "cycles": 486,
  "celldelta": 12,
  "state": "Discharging"
}
The device also publishes an availability (online/offline) topic with a Last-Will-and-Testament, so every sensor correctly greys out in Home Assistant if the device loses power or WiFi instead of silently freezing on its last value:
pylon-monitor/status → "online" (retained) or "offline" (LWT, retained)Option 2 — REST API polling
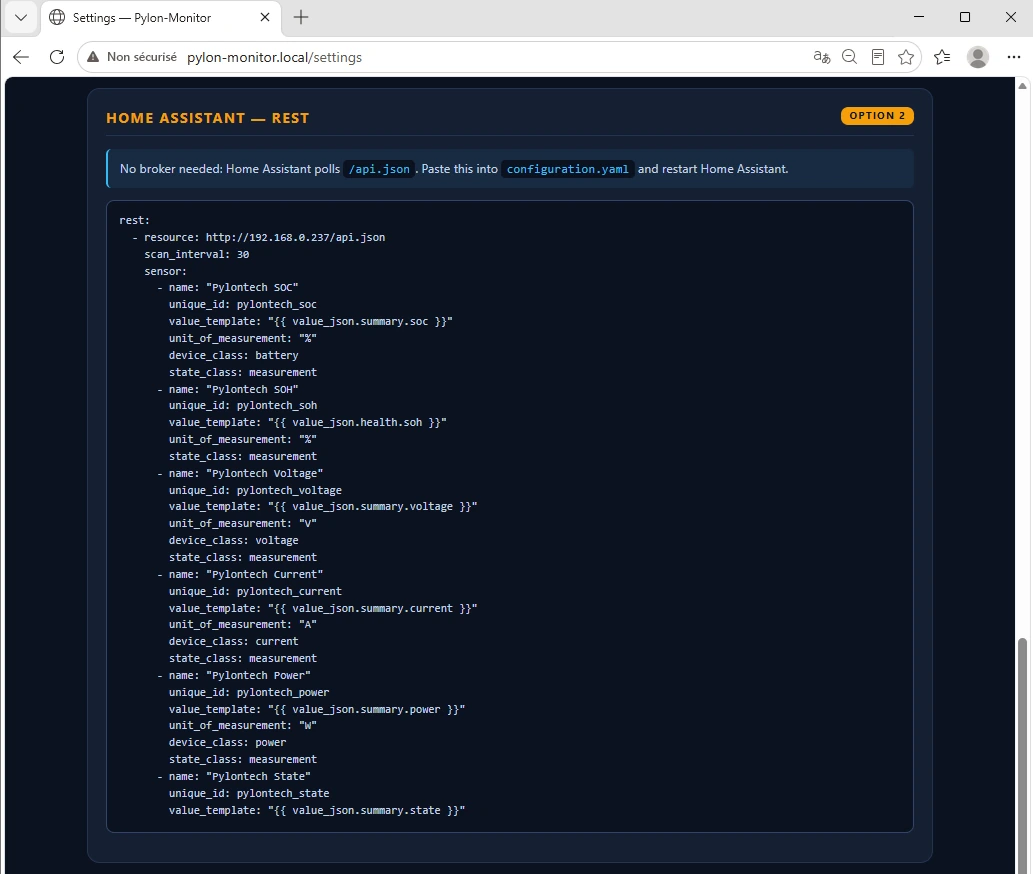
No MQTT broker required. Home Assistant's built-in rest platform polls the device every 30 seconds and creates 6 sensors. The YAML block below is the exact one the firmware itself generates inside the Settings page (with your current IP pre-filled) — copy-paste it from there for zero typing, or use the version below.
The JSON the device returns
GET http://<DEVICE-IP>/api.json

{
  "system": "pylon-monitor",
  "firmware": "2.2",
  "battery_link": true,
  "summary": {
    "soc": 94,
    "voltage": 48.62,
    "current": -7.20,
    "power": -350.10,
    "state": "Discharging",
    "units": 2
  },
  "health": {
    "soh": 96,
    "cycles": 486,
    "charge_cnt": 782,
    "discharge_cnt": 0
  },
  "unitsDetail": [
    { "label": "Battery 1", "soh": 97, "cycles": 480, "...": "..." },
    { "label": "Battery 2", "soh": 95, "cycles": 492, "...": "..." }
  ]
}
Shown trimmed to the fields used below — the real response also includes per-cell voltages, WiFi/network info and alarm thresholds. unitsDetail has one entry per physical battery Pylontech reports (only present past a single unit); summary.units tells you how many.
This is trimmed for readability — the real response also includes temps, cells, net and alarms objects, plus unitsDetail (per-battery voltage, SOC, SOH, cycles… if your pack has more than one unit). Note that SOH lives under health, not summary — a common copy-paste mistake.
Paste this in configuration.yaml
# If Settings > Public JSON access has an Access key set, append
# ?key=YOUR_KEY to the resource URL below (works from the LAN either way;
# only required once the device is reachable beyond your home network).
rest:
  - resource: http://<DEVICE-IP>/api.json
    scan_interval: 30
    sensor:
      - name: "Pylontech SOC"
        unique_id: pylontech_soc
        value_template: "{{ value_json.summary.soc }}"
        unit_of_measurement: "%"
        device_class: battery
        state_class: measurement
      - name: "Pylontech SOH"
        unique_id: pylontech_soh
        value_template: "{{ value_json.health.soh }}"
        unit_of_measurement: "%"
        state_class: measurement
      - name: "Pylontech Voltage"
        unique_id: pylontech_voltage
        value_template: "{{ value_json.summary.voltage }}"
        unit_of_measurement: "V"
        device_class: voltage
        state_class: measurement
      - name: "Pylontech Current"
        unique_id: pylontech_current
        value_template: "{{ value_json.summary.current }}"
        unit_of_measurement: "A"
        device_class: current
        state_class: measurement
      - name: "Pylontech Power"
        unique_id: pylontech_power
        value_template: "{{ value_json.summary.power }}"
        unit_of_measurement: "W"
        device_class: power
        state_class: measurement
      - name: "Pylontech State"
        unique_id: pylontech_state
        value_template: "{{ value_json.summary.state }}"
      # One pair of sensors per physical battery Pylontech reports (see
      # summary.units above) — this example covers 2; add or drop a pair to
      # match your own pack. The device's own Settings page generates this
      # part for you automatically, sized to what it actually detects.
      - name: "Pylontech Battery 1 SOH"
        unique_id: pylontech_battery1_soh
        value_template: "{{ value_json.unitsDetail[0].soh }}"
        unit_of_measurement: "%"
        state_class: measurement
      - name: "Pylontech Battery 1 cycles"
        unique_id: pylontech_battery1_cycles
        value_template: "{{ value_json.unitsDetail[0].cycles }}"
        state_class: measurement
      - name: "Pylontech Battery 2 SOH"
        unique_id: pylontech_battery2_soh
        value_template: "{{ value_json.unitsDetail[1].soh }}"
        unit_of_measurement: "%"
        state_class: measurement
      - name: "Pylontech Battery 2 cycles"
        unique_id: pylontech_battery2_cycles
        value_template: "{{ value_json.unitsDetail[1].cycles }}"
        state_class: measurement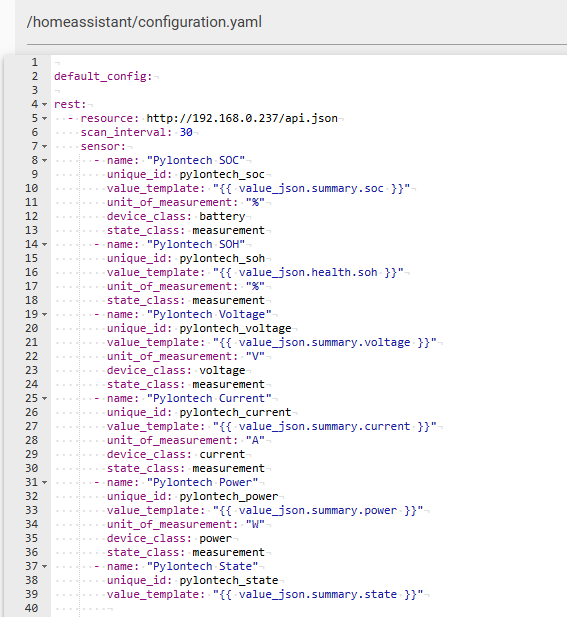
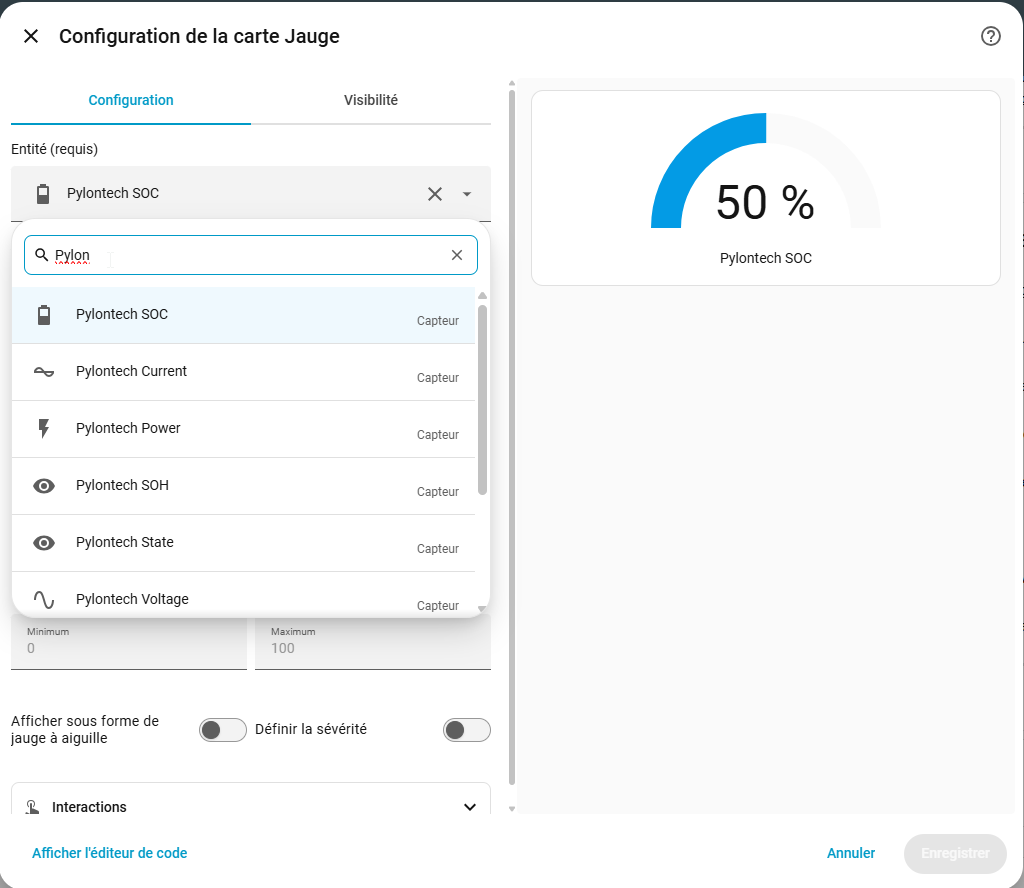
Restart Home Assistant. The 6 sensors appear under Settings → Devices & Services → Entities, searchable by pylontech.
Node-RED
Use an http request node, method GET, URL http://<DEVICE-IP>/api.json, return a parsed JSON object. Then read msg.payload.summary.soc (or any other field) downstream. If MQTT is configured on the device, you can also subscribe directly to pylon-monitor/state with an MQTT-in node — no polling needed.
Jeedom
Install the JSON plugin, point an equipment to http://<DEVICE-IP>/api.json, then map JSON paths to commands (e.g. summary>soc, summary>voltage, summary>state).