What's in the box
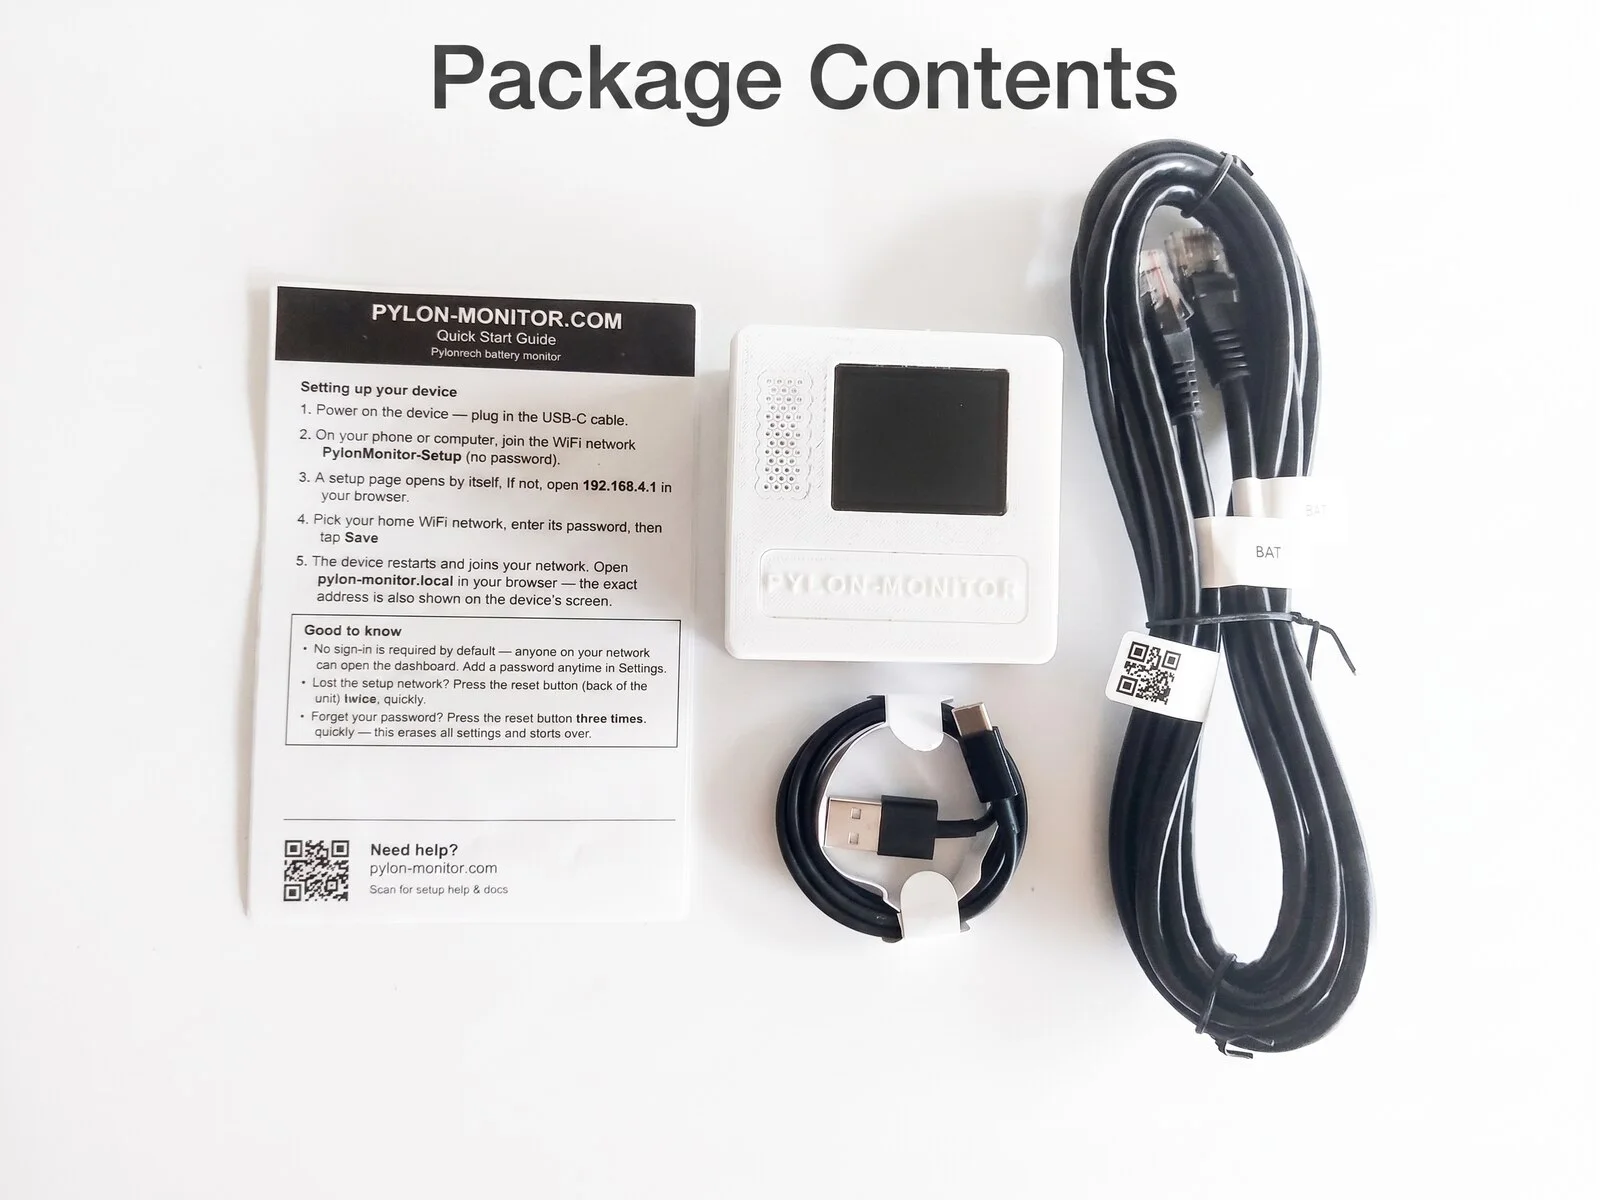
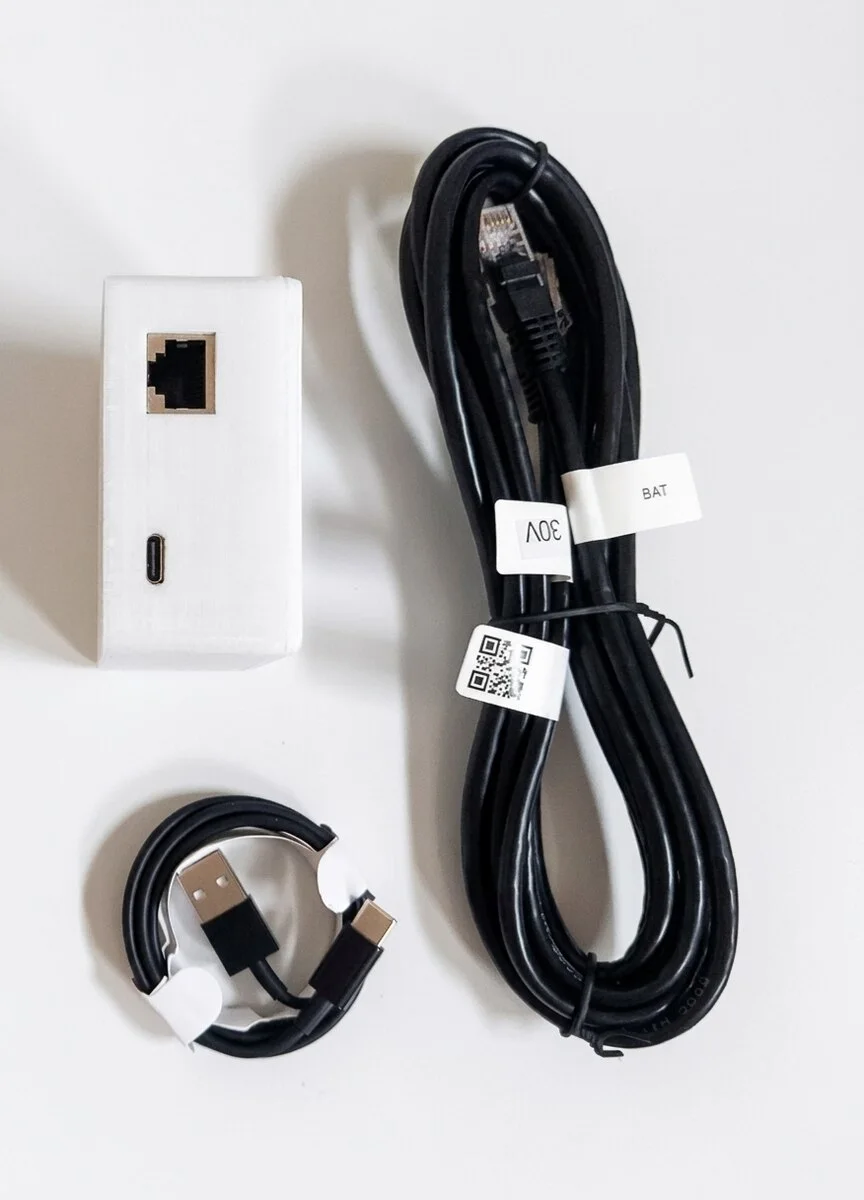
- Pylon-Monitor device (compact, rugged enclosure, integrated TFT screen) — 79 g
- RJ45 Ethernet cable (standard, straight-through) + USB power cable (USB-A to USB-C) — 14 g combined
- Quick start card
Net weight ~93 g · Shipping weight (incl. ~30 g packaging) ~123 g.
Step-by-step
-
Plug into the battery
Connect one end of the RJ45 cable into the Console port of your Pylontech battery (top of the master battery in a stack). Plug the other end into the RJ45 socket on the Pylon-Monitor.
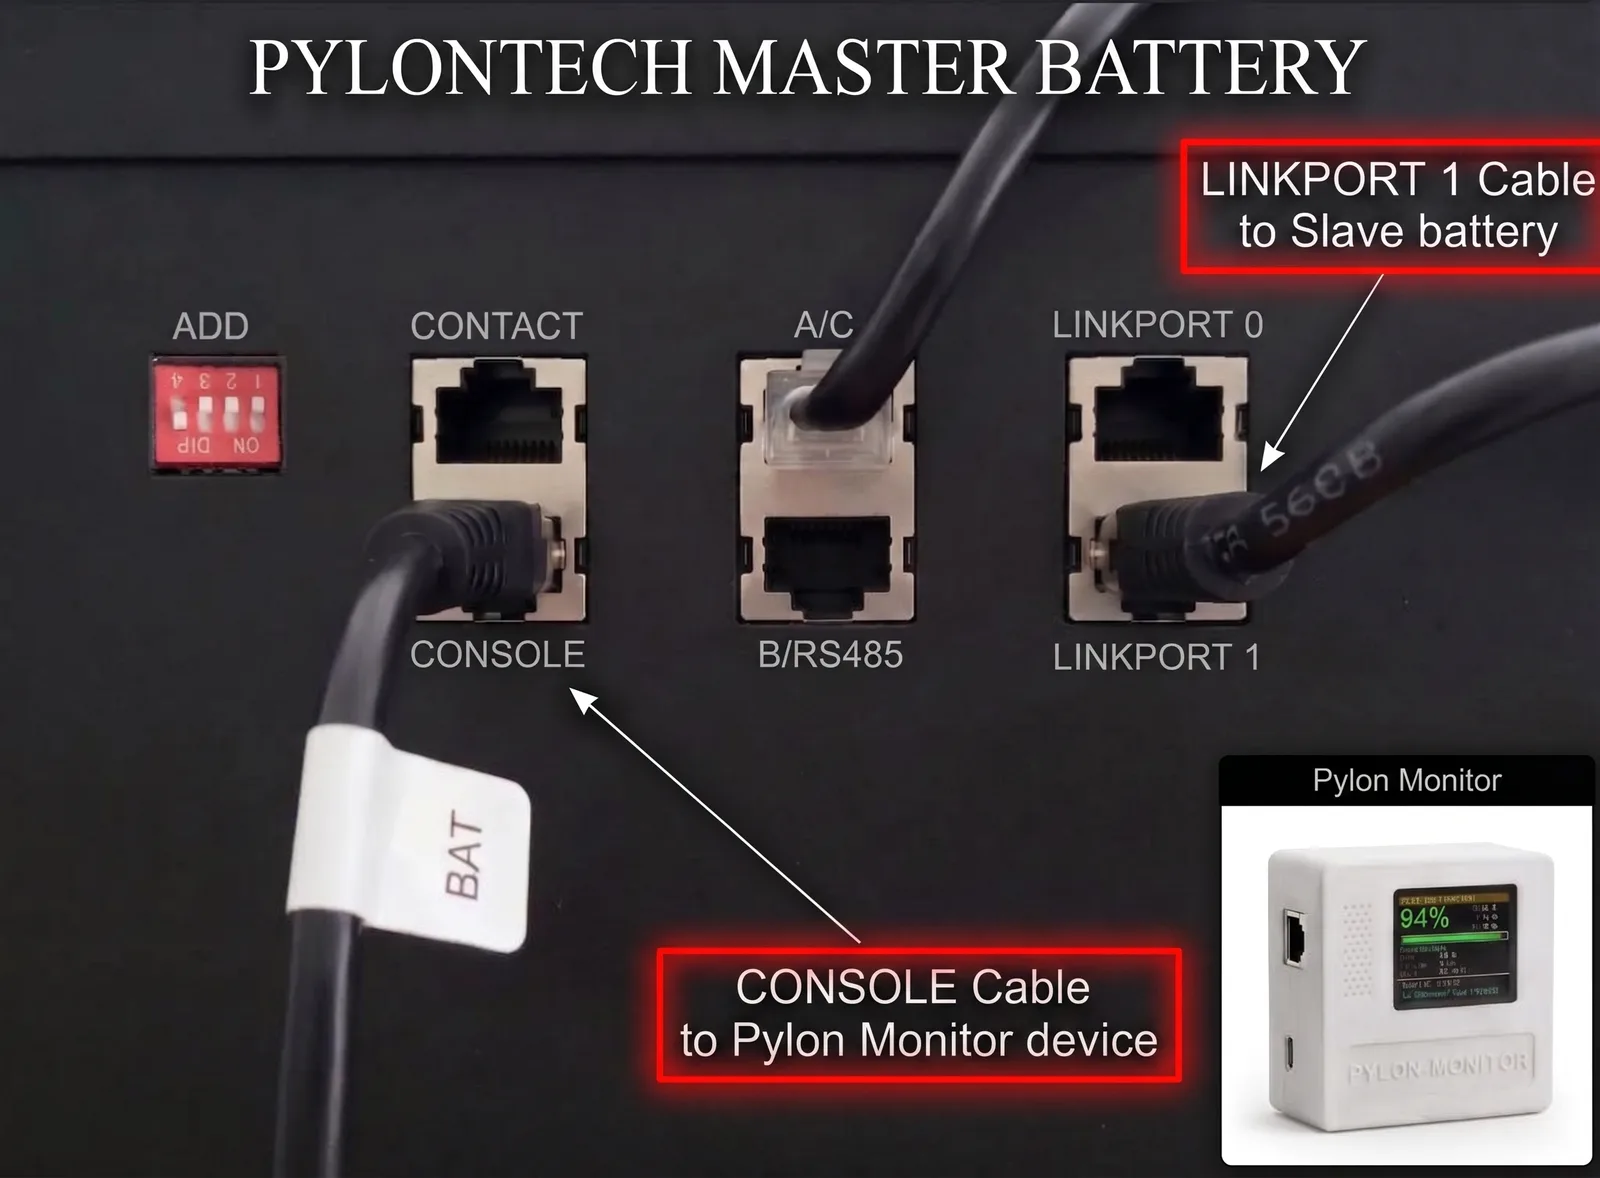
On the master battery: CONSOLE goes to the Pylon-Monitor, LINK PORT 1 goes to the slave battery. The mistake almost everyone makes: LINK PORT 1, not LINK PORT 0
The cable that chains your master battery to the first slave must leave LINK PORT 1 on the master — never LINK PORT 0. It plugs into LINK PORT 0 on the slave, and every further battery repeats the same 1 → 0 pattern. Wired the other way round the master never sees the rest of the stack, so Pylon-Monitor reports a single battery no matter how many you own. -
Power the device
Plug the USB-C cable into the Pylon-Monitor and into any 5V USB source. The TFT screen lights up within a couple of seconds.
-
Connect to the setup WiFi
On your phone or laptop, open WiFi settings. A new network called
PylonMonitor-Setupappears. Connect to it (no password). A captive portal opens automatically; if not, browse tohttp://192.168.4.1. -
Pick your home WiFi
The portal shows a list of nearby networks. Tap yours, enter the password, hit
Save and connect. The Pylon-Monitor reboots and joins your network.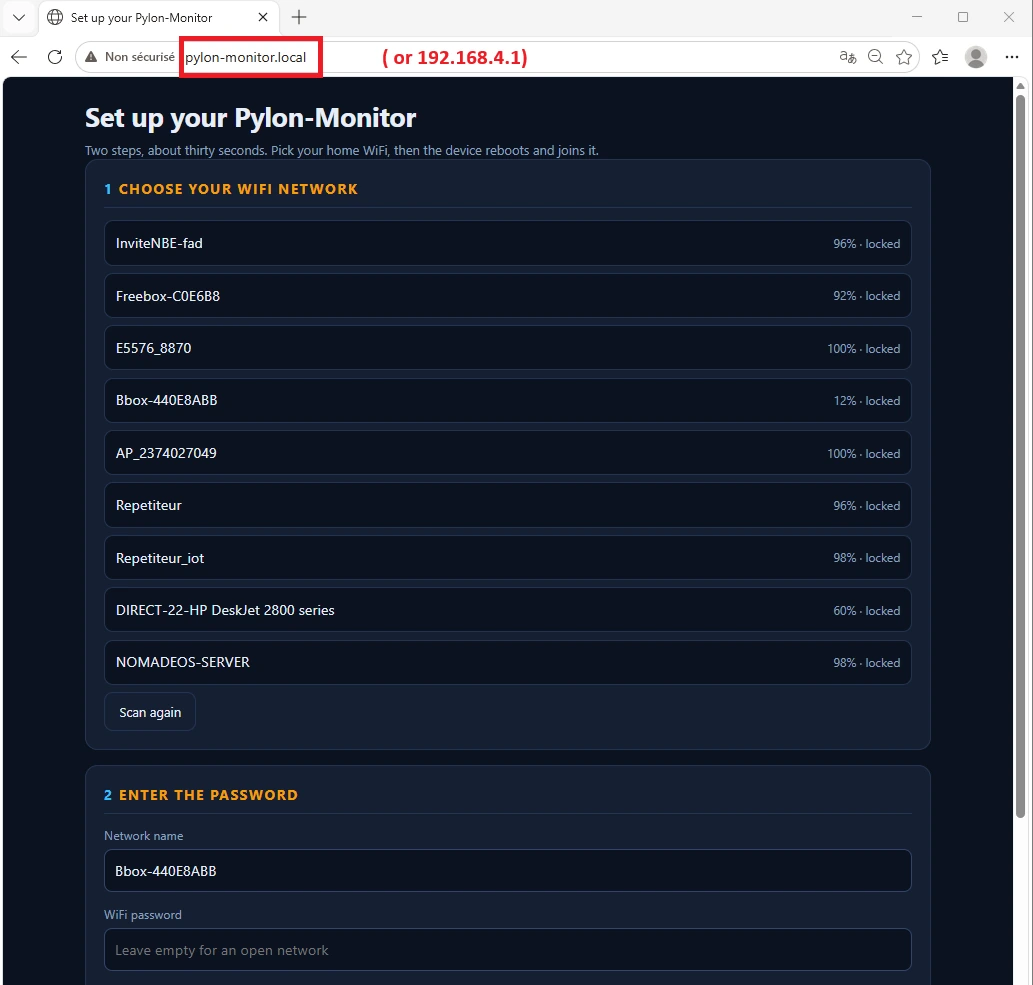
-
Open the dashboard
After reboot, the TFT screen shows the device's IP address (the one your router assigned). Type it into your browser, or try
http://pylon-monitor.localif your network supports mDNS. You'll see the live dashboard.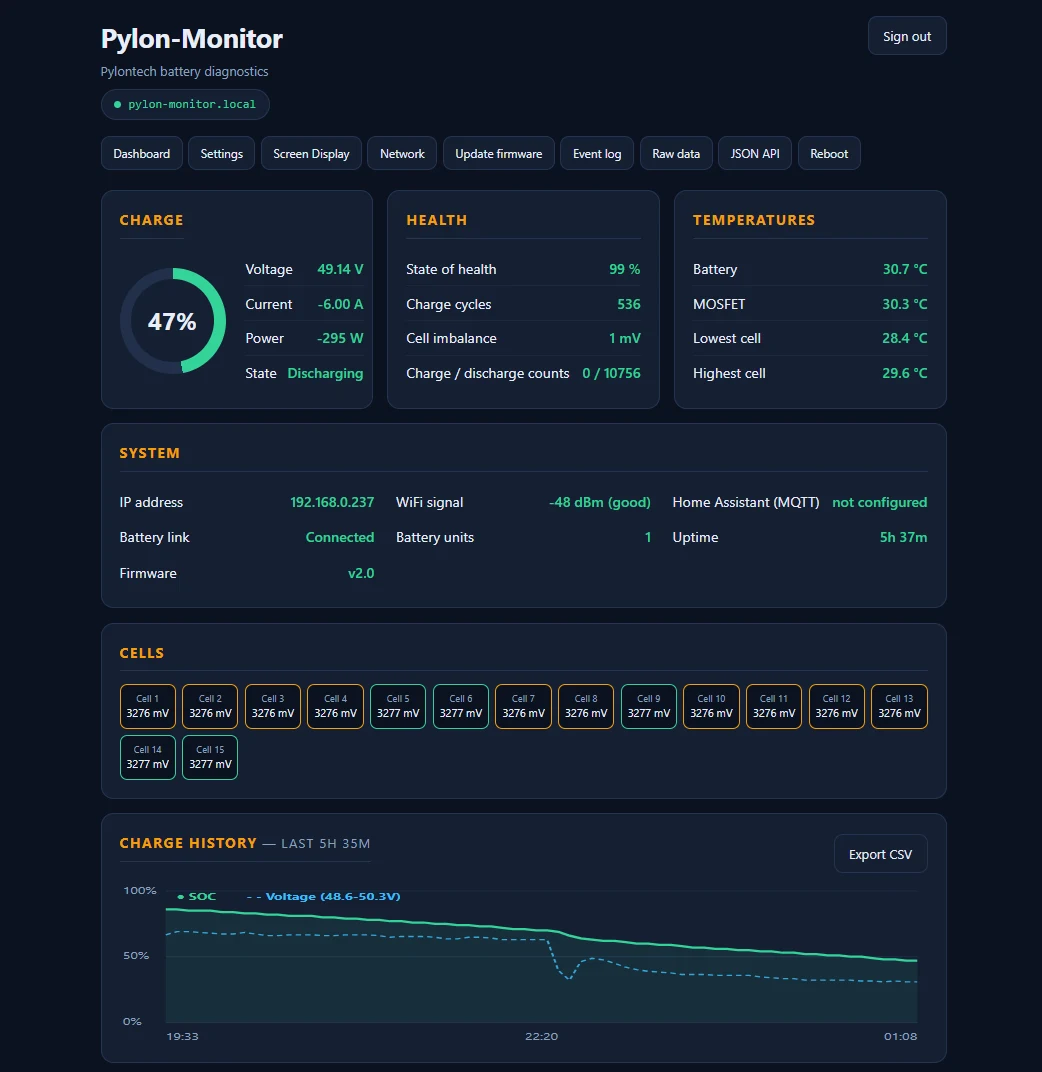
TFT screen layout
Once connected to the battery, the TFT screen shows by default:
- State of Charge in giant digits, always shown
- Voltage, current and power beside the SOC
- A coloured charge gauge, the state (Charging/Discharging), SOH, cycle count and temperature
- In the footer: the IP address and
hostname.local
Every element except the percentage can be toggled individually from the dashboard's Screen Display page, with a live preview.
Troubleshooting
The TFT screen stays blank
Check the USB cable and power source. Try a different USB port. The device draws very little, but it does need a proper 5V supply.
"No battery data" on the TFT screen
The RJ45 cable is plugged into the wrong port. Pylontech batteries have several RJ45 sockets — make sure you're using the one labeled Console, not RS485, CAN or Link.
Only one battery shows up, but I have several
Almost always the stack link cable: it must leave LINK PORT 1 on the master battery and land in LINK PORT 0 on the first slave — not the other way round, and never LINK PORT 0 to LINK PORT 0. Each further battery repeats the same 1 → 0 pattern. Until that chain is right the master has nothing to relay, so Pylon-Monitor reports the master alone. See the wiring photo above.
I don't see PylonMonitor-Setup
The device may have already joined a previous network. 2 quick taps in a row on the reset button (on the back of the enclosure) to reopen the portal (temporary, nothing is erased), or use the Factory Reset button in the web dashboard if you still have access to it.
pylon-monitor.local doesn't open
mDNS may be disabled on your network. Just use the IP address shown on the TFT screen instead.
The dashboard works, but I want it in Home Assistant
You're one short YAML paste away — the device generates it for you, ready to copy. Follow the Home Assistant integration guide →
Three levels of reset
The Pylon-Monitor has three distinct mechanisms — don't confuse them:
- Reconnect to different WiFi (nothing else erased): 2 quick taps in a row on the reset button (on the back of the enclosure). The
PylonMonitor-Setupportal reopens for this session so you can pick a new network — your MQTT, alarm and sign-in settings stay untouched. - Wipe everything from the dashboard (WiFi, MQTT, alarms, sign-in): from the dashboard → Settings → scroll to the Danger zone → Factory reset → confirm.
- Forgot your password, or can't reach the dashboard? 3 quick taps in a row on the reset button (on the back of the enclosure). The device wipes every setting — including the username and password, which reset to
admin/adminwith sign-in disabled by default — with no need to know the old password. Physical access to the device is always enough to regain control.
In every case, the device reboots into PylonMonitor-Setup mode.