That's the whole device.
One small box, one captive portal, one dashboard, one JSON endpoint, one update button. No cloud, no app, no subscription — €59 once.
No marketing fluff. These are the real pages served by your Pylon-Monitor — the same monitoring, diagnostics and Home Assistant integration screens — at http://pylon-monitor.local, exactly what you'll see the moment you plug it in. And that moment is under 2 minutes after opening the box.
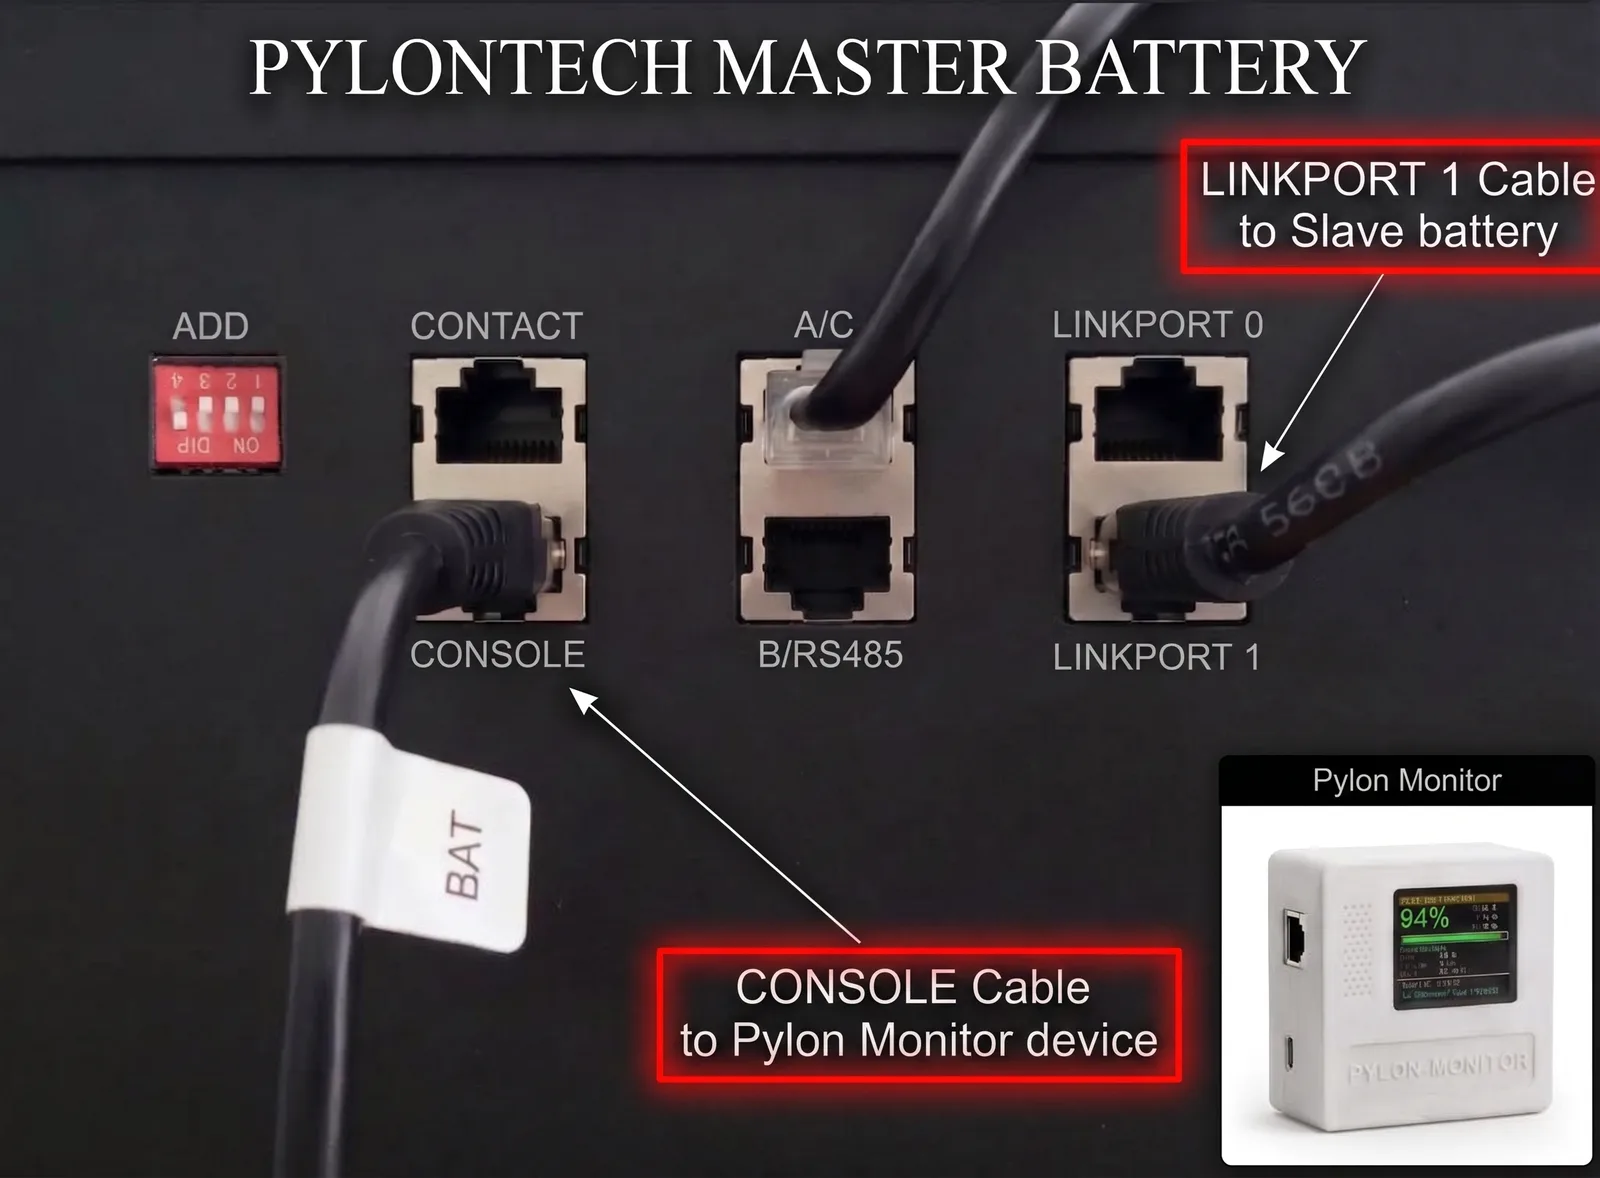
A crisp 1.8" IPS TFT panel shows the State of Charge in giant digits, with voltage and current beside it and SOH and cycle count below — readable across the room, no phone required.
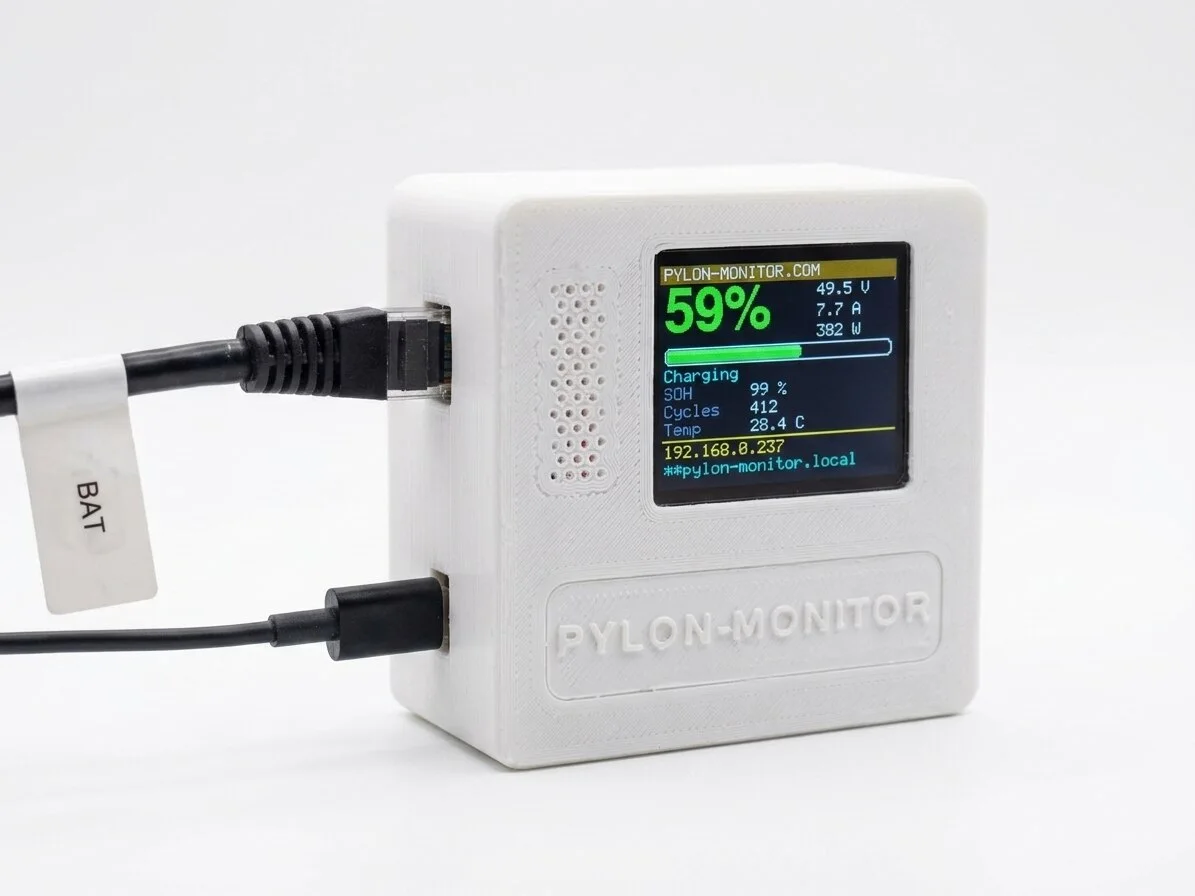
No fan, no buttons to fiddle with — just glance at the box.
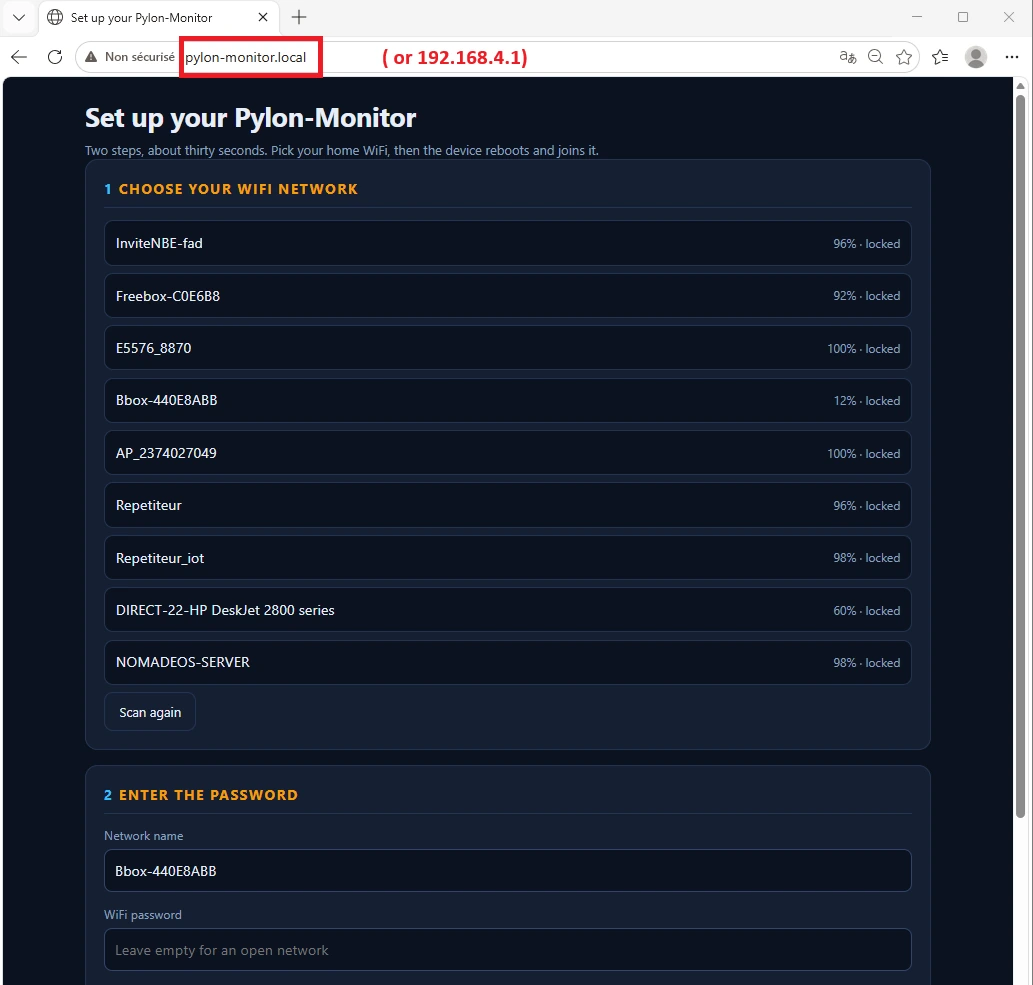
On first power-on, the Pylon-Monitor creates its own network PylonMonitor-Setup. Connect from any phone, the setup page opens by itself.
Out of the box, anyone on your network can open the dashboard with zero friction — no login screen in the way. If the device is reachable beyond your LAN (port-forwarded, VPN…), flip one checkbox in Settings to require this username/password screen, shown here.
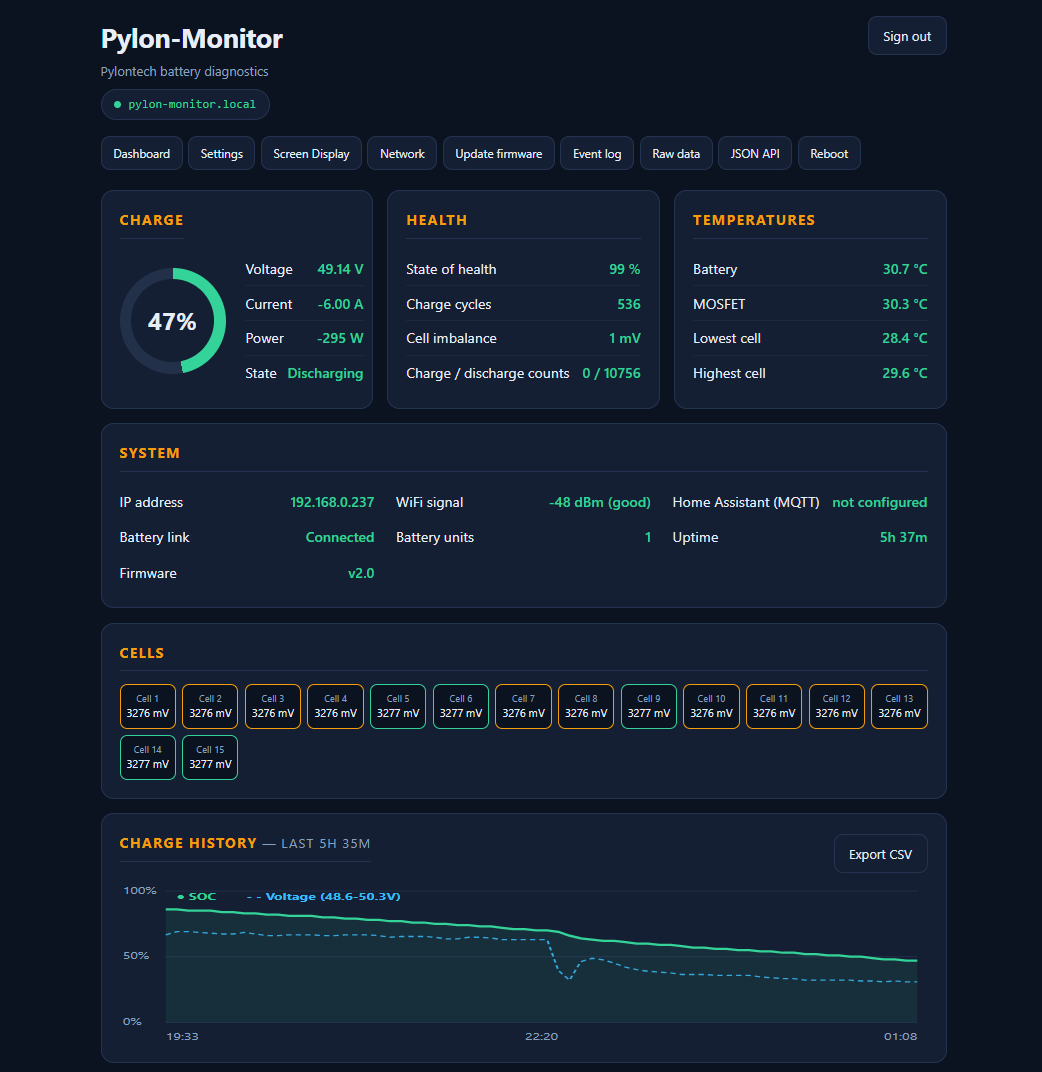
The home screen of the device. Live cards for Charge, Health, Temperatures, System and Cells, plus a 24h history graph — and one nav strip to jump anywhere in two clicks.
The physical screen's percentage is always shown, but everything else around it is up to you. Three quick presets, or tick elements individually — the live preview updates instantly, save, and the real screen matches it exactly within seconds.
hostname.local footer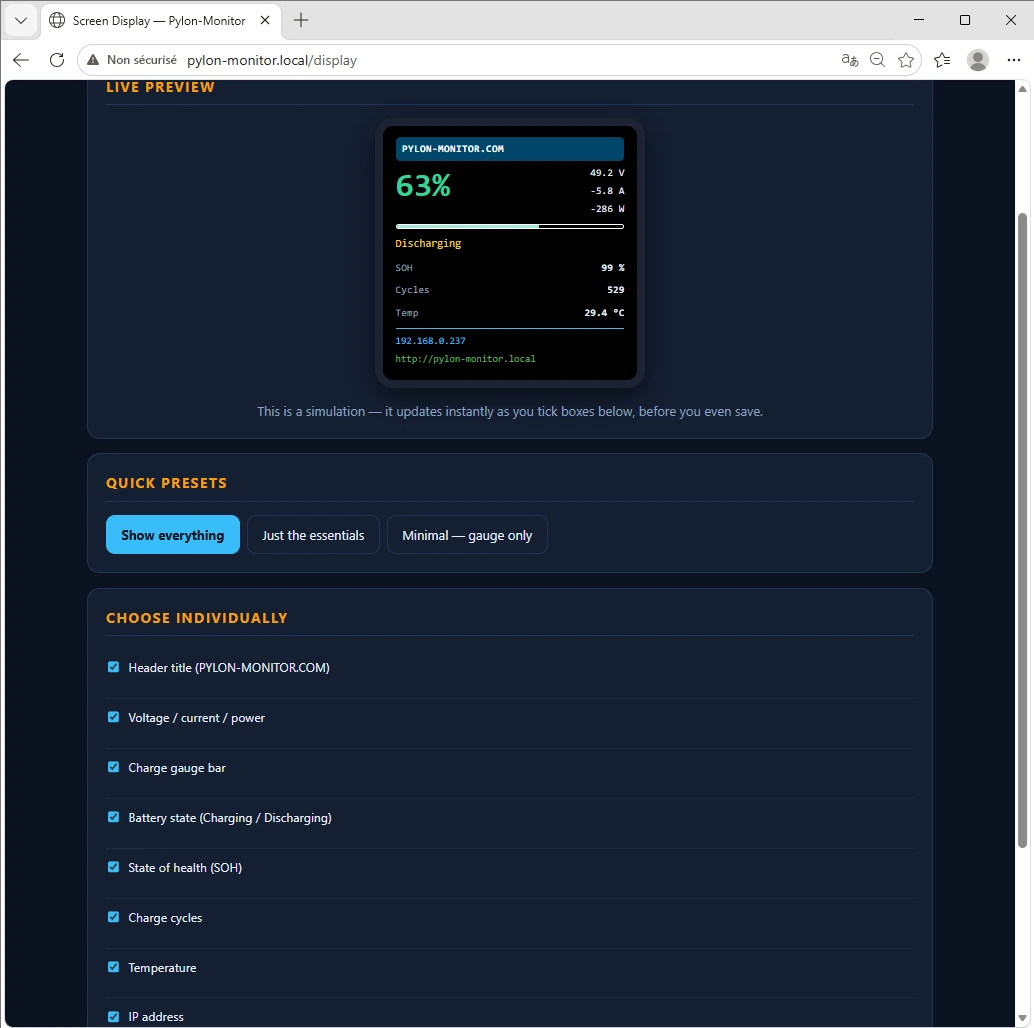
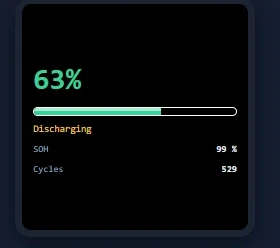 Just the essentials
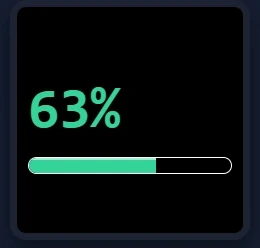 Minimal — gauge only
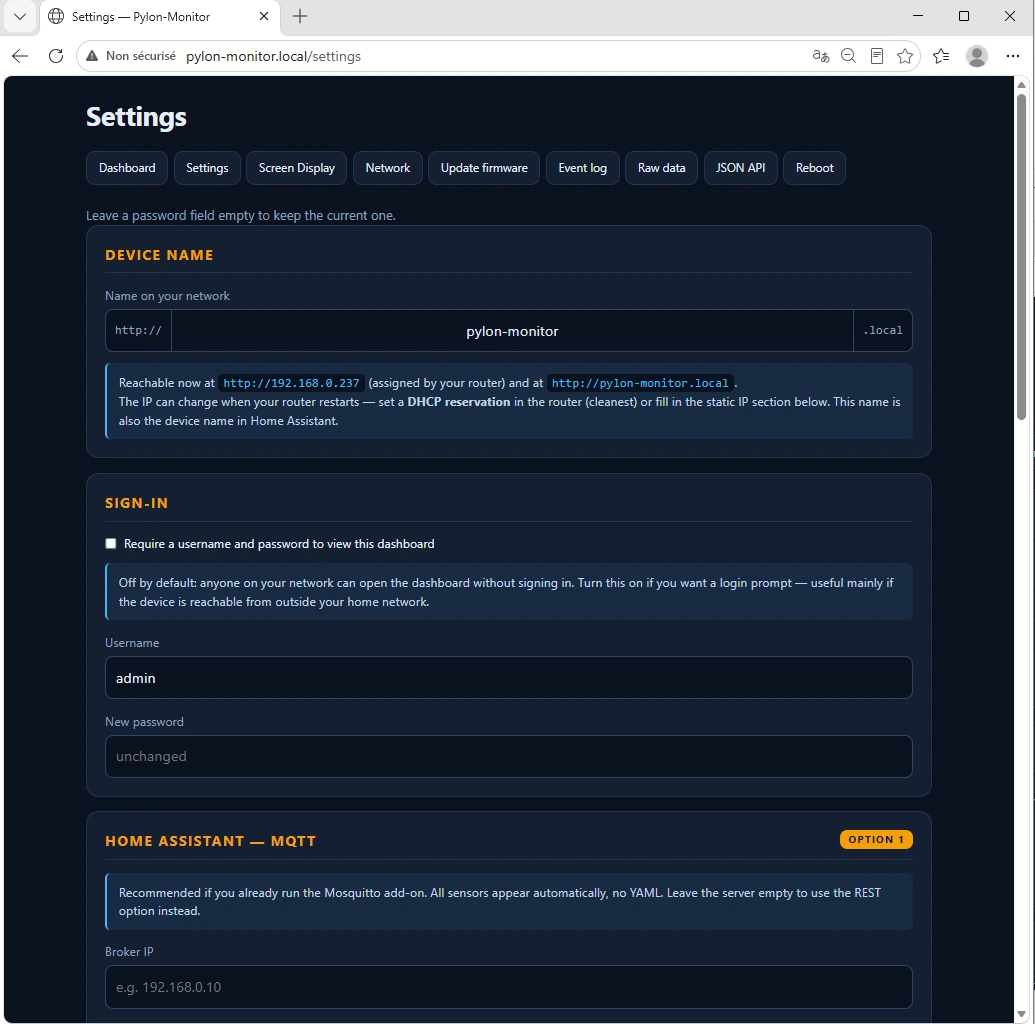
Hostname, login, static IP, MQTT broker, REST API helper and Pushover emergency notifications. All in one form, with inline hints that show your current IP and copy-paste-ready YAML.
http://yourname.local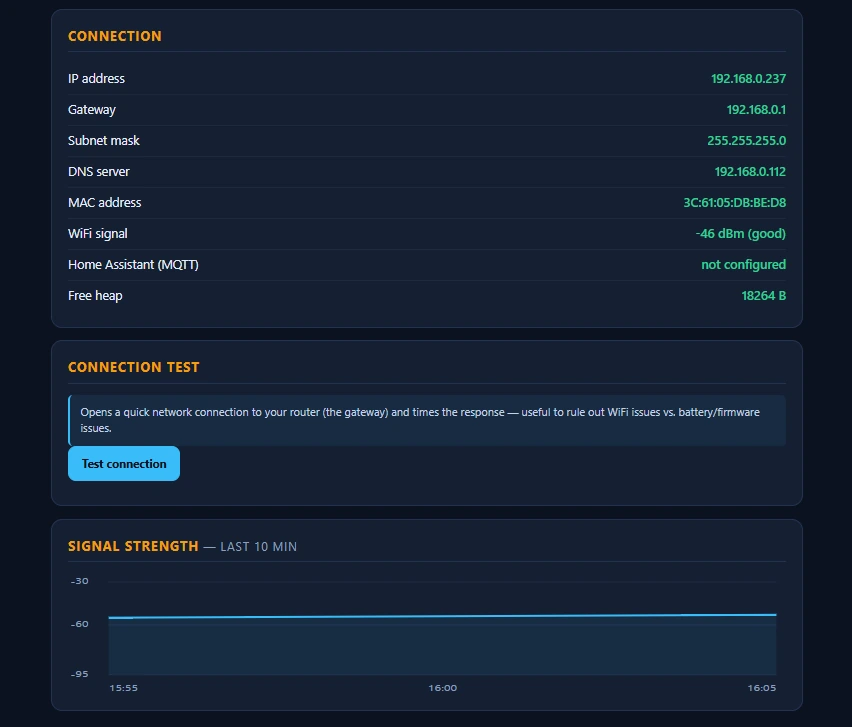
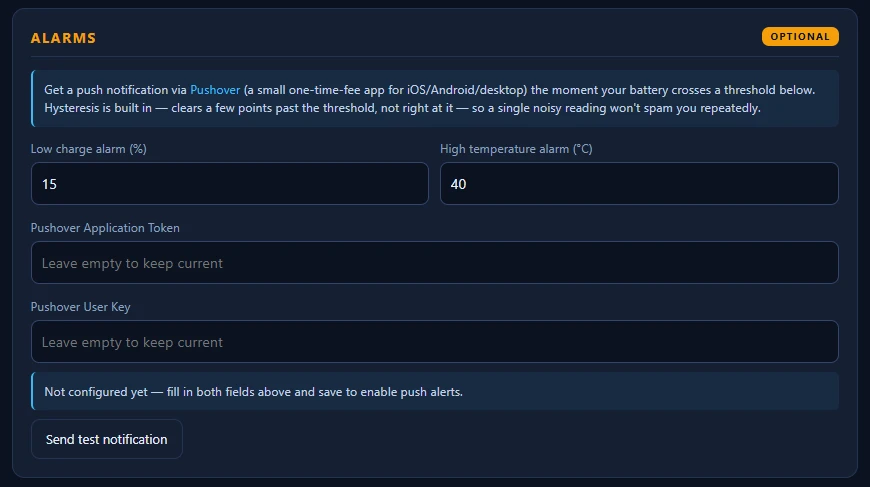
Alarms — set thresholds, add Pushover, test with one click
No serial monitor, no guesswork. Three pages cover troubleshooting end to end, plus configurable alerts so problems reach your phone before you go looking for them.
The dashboard and /api.json above are LAN-only by design. Want to check your battery from the office or on a trip as well? Flip one checkbox in Settings to publish it to the cloud, for free, at a private link secured by your own access key — no VPN, no port forwarding, no dynamic DNS.
/api.json from outside your LAN becomes the URL's token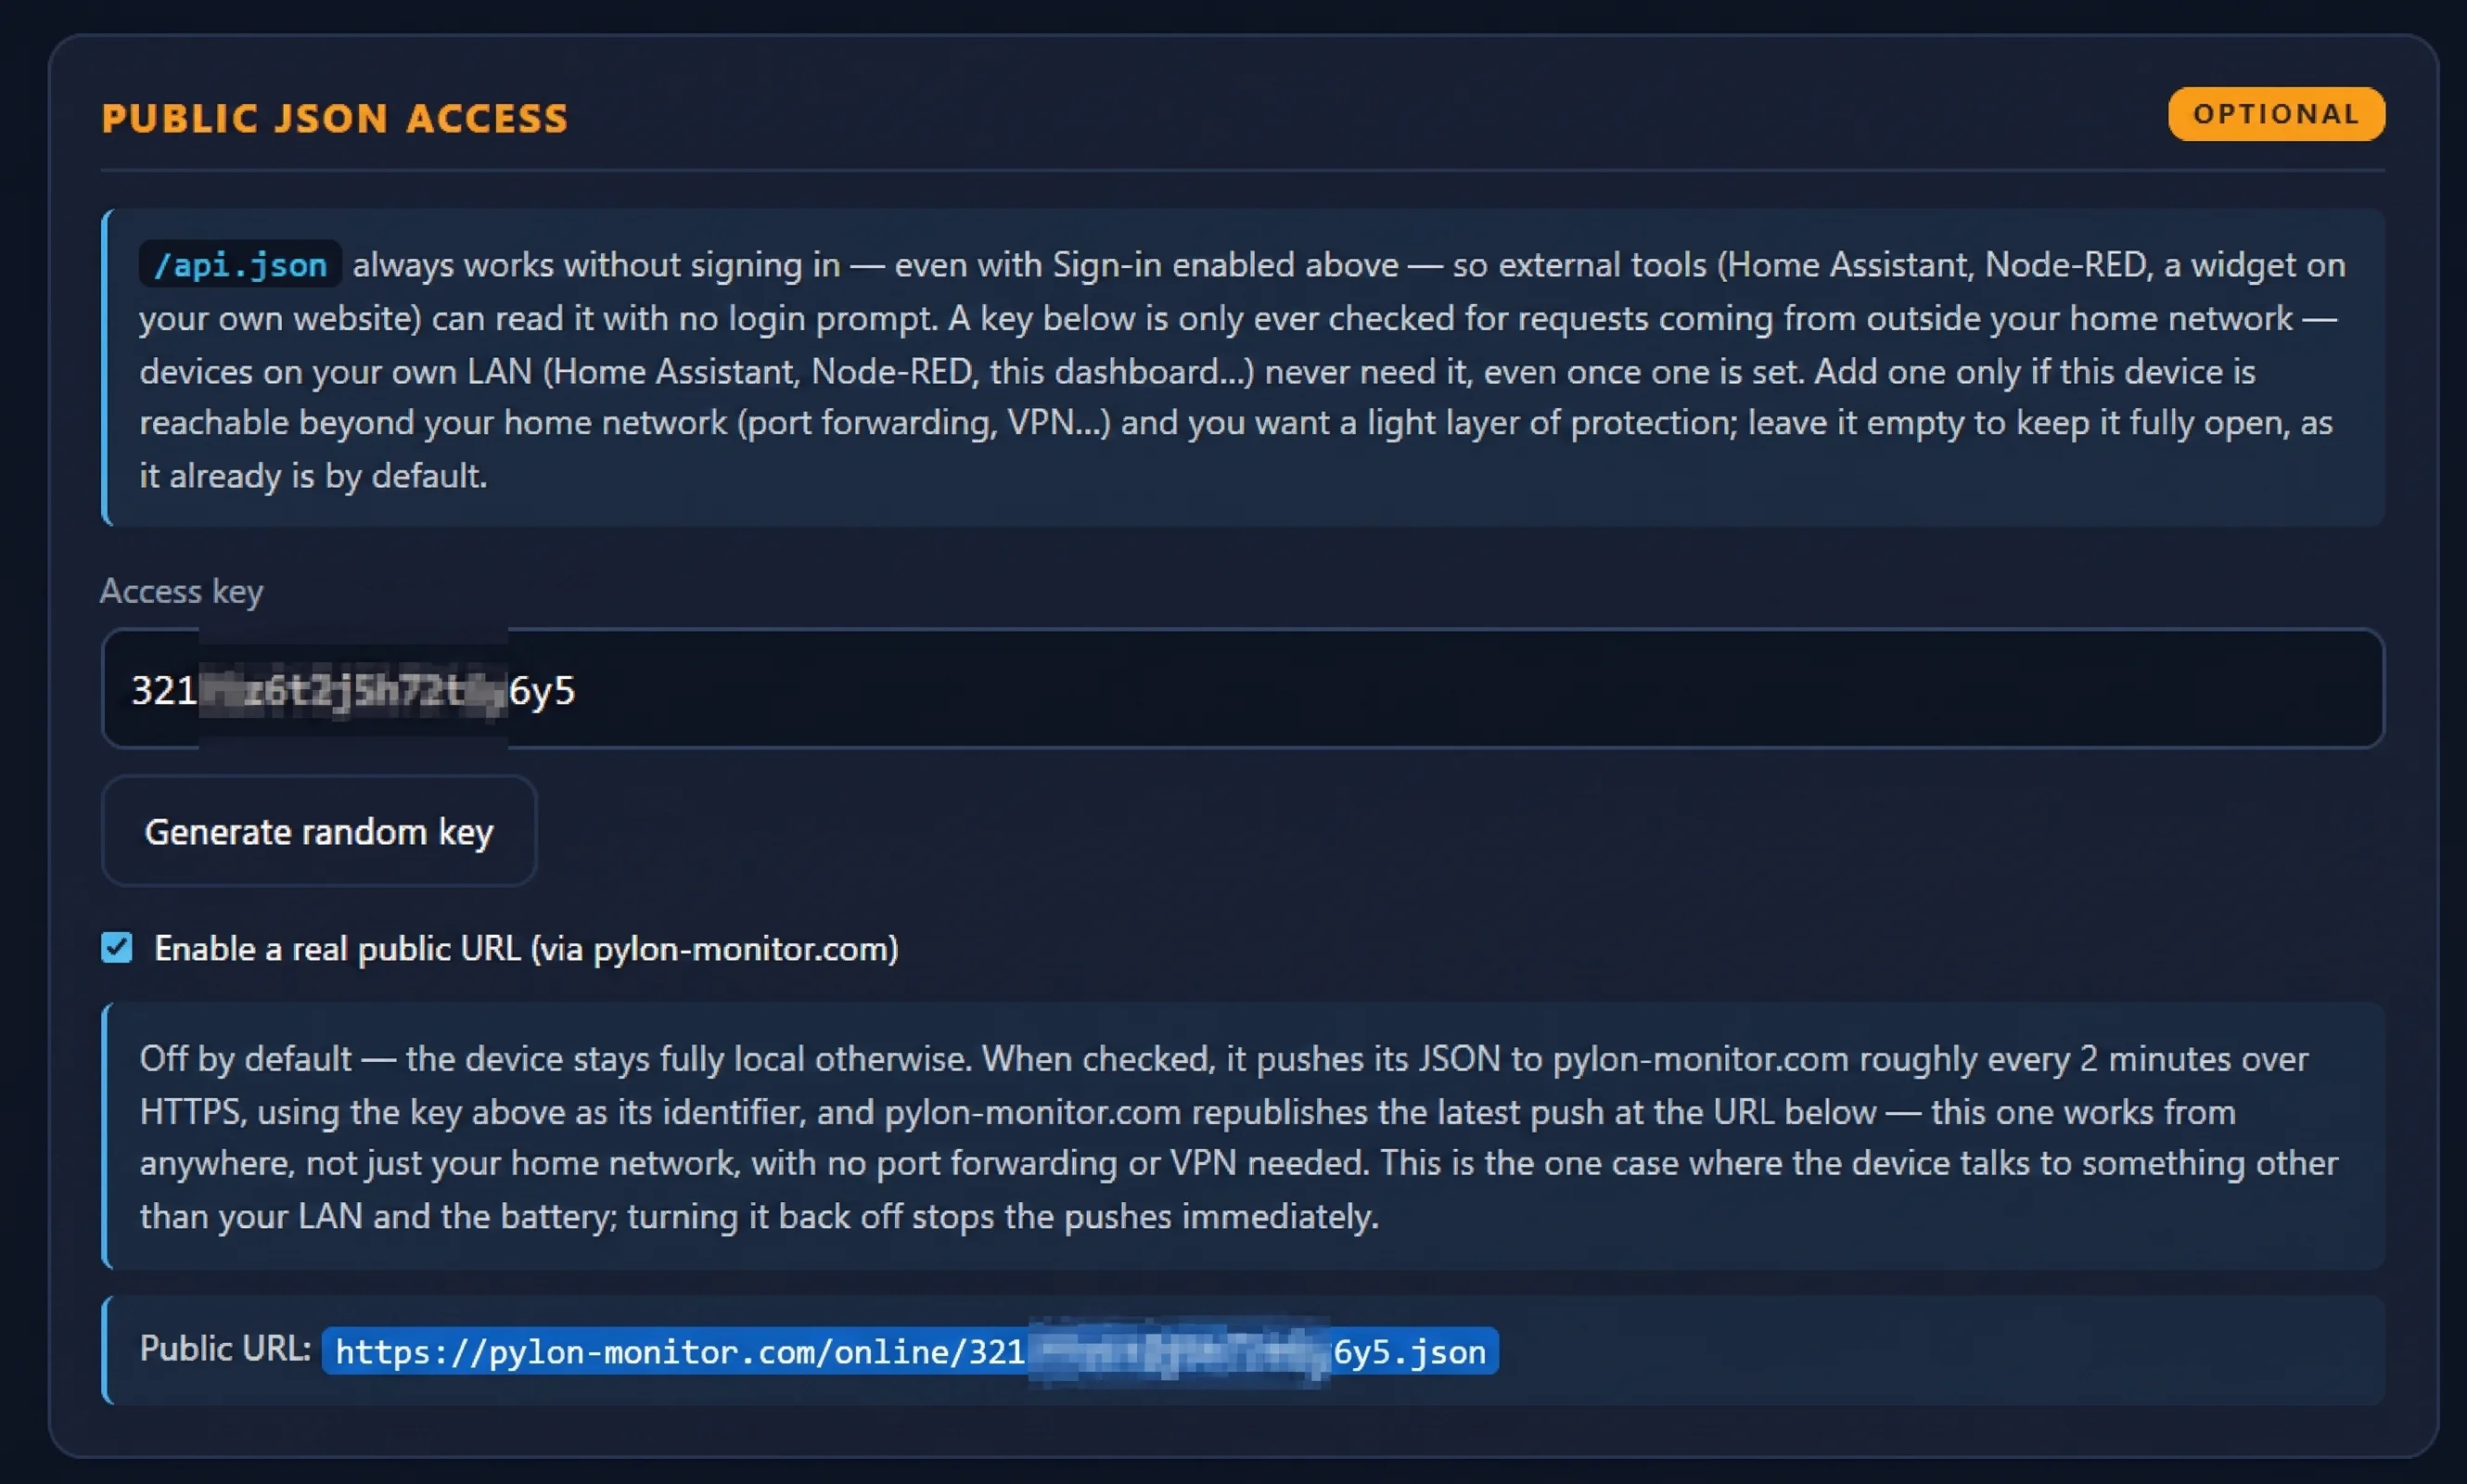
Download the .bin from the firmware page and upload it from your dashboard — it reboots straight into the new version. No cables, no soldering, no Arduino IDE. Your settings are preserved across updates.
.bin for free from the firmware page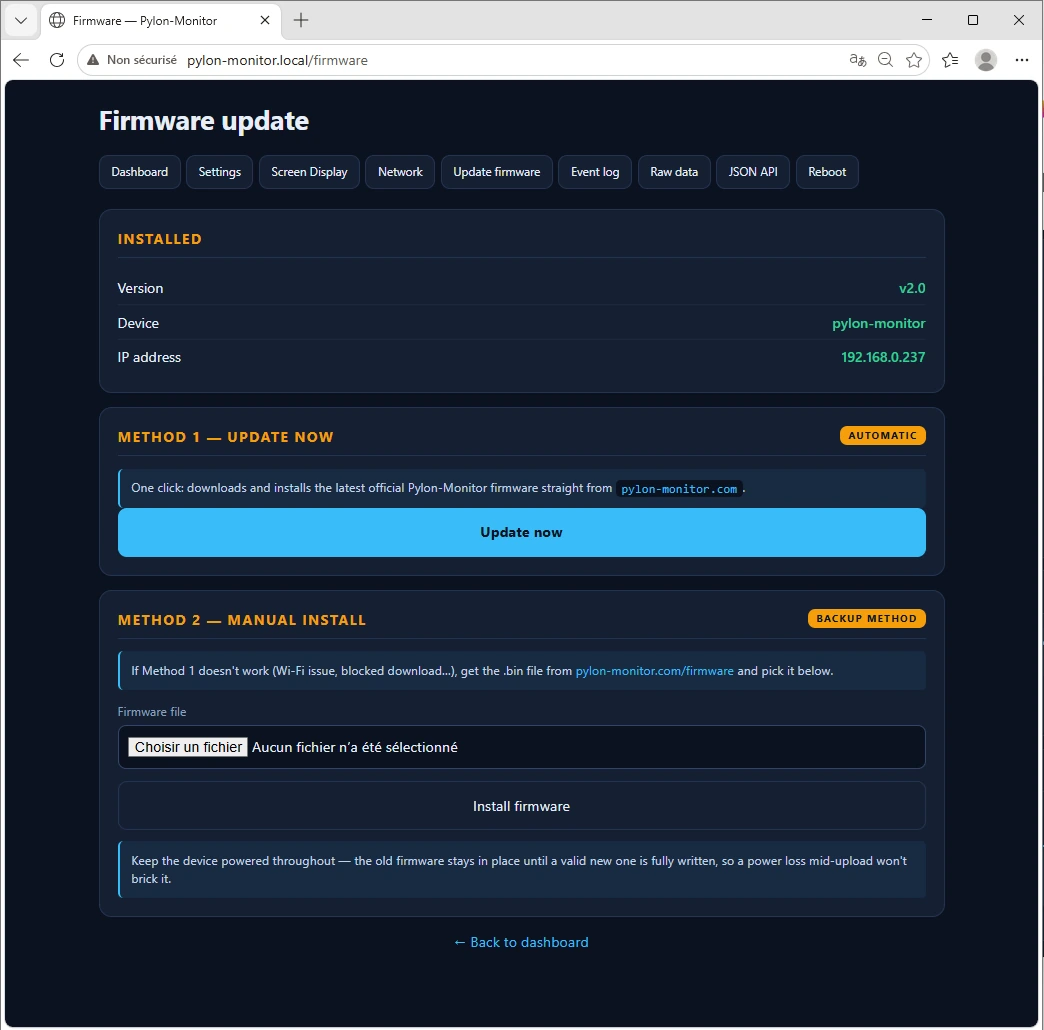
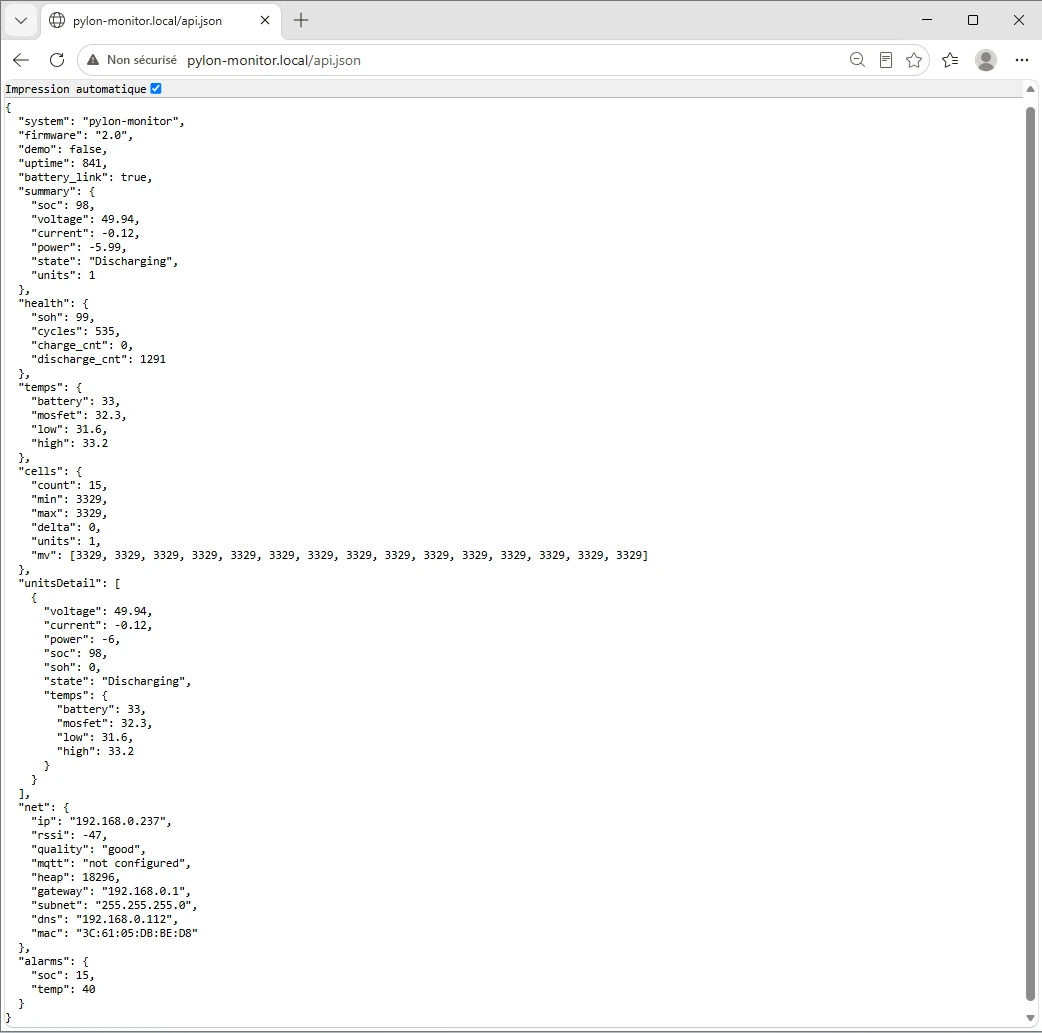
GET /api.json hands back the entire device state in one plain HTTP call — charge, health, temperatures, per-cell voltages, network status, alarms. No auth, no SDK, no vendor lock-in: it's just JSON, so anything that can make an HTTP request can use it.
Built into the firmware, both ways: MQTT auto-discovery gives you 10 sensors with zero YAML, or point the native rest platform at /api.json for 6 sensors with a YAML block the device generates for you.
Install the JSON plugin, point an equipment at /api.json, map paths like summary>soc or net>rssi to commands. No custom plugin needed.
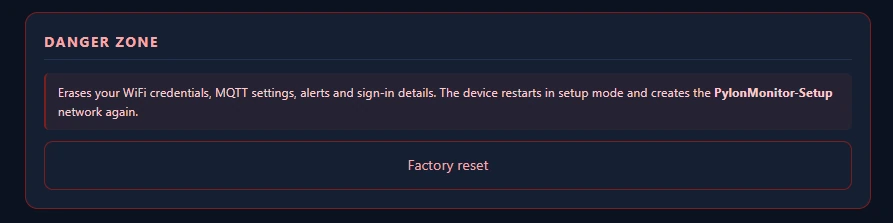
Reboot is one click away in the navigation strip, with a confirmation dialog first. Factory Reset lives inside Settings' Danger zone — it wipes WiFi credentials, MQTT, alarms and sign-in, then reopens the captive portal so you can start fresh.
One small box, one captive portal, one dashboard, one JSON endpoint, one update button. No cloud, no app, no subscription — €59 once.