Short answer: there are four ways to view the data from a Pylontech battery. PYLON Console (or BatteryView) on a laptop shows everything, but only while the laptop is plugged in. Your inverter's screen or app is always on but shows the stack as one big battery, with no per-cell detail. A small device on the Console port gives you both: every cell, all the time, on a web page. And with a JSON API you can build your own view. Which one fits depends on how often you look and what you want to catch.
What people mean by a "Pylontech viewer"
Search for a Pylontech viewer and you will find several quite different things under the same name: a Windows program, an inverter's phone app, a web page on a local IP address, a Home Assistant dashboard. They are not interchangeable. Each one reads a different port on the battery, so each one shows a different part of what the battery knows about itself.
Below are the realistic options, what each one actually displays and where each one stops. None of them is dismissed: the laptop route is free and works, and for some people it is the right answer.
Option 1: PYLON Console or BatteryView on a laptop
This is the official route. Pylontech's Windows software, usually PYLON Console and sometimes supplied as BatteryView, talks to the battery's Console (RS-232) port through an RJ45-to-serial adapter. It is free, it is complete, and it is what installers use on commissioning day.
What it shows: practically everything. SOC, SOH, each cell's voltage, temperatures, cycle count, alarm flags, firmware version, and details for each module in the stack.
Where it stops: you only see all that while you are sitting next to the battery with a laptop and the right cable. No history, no trend, no alert. In practice most owners run it once at installation and maybe once more when something already seems wrong, which is exactly when six months of trend data would have helped. Our monitoring guide explains why that gap matters.
Option 2: your inverter's screen or app
If your Pylontech stack is connected to a Victron, Deye, Sunsynk, Growatt, Sofar, Solis or similar hybrid inverter over CAN or RS485, the inverter already shows battery data on its screen and usually in its app or web portal. For many people this is the viewer they use every day, and to check "am I charging, and how full am I", it is perfectly fine.
Its limit is built into the link, not into the app. CAN and RS485 are control protocols, and they present the whole stack as a single virtual battery. So no SOH per module, no individual cell voltages, no temperature per module. The inverter's software is not lazy: the battery simply never sends those values over that link. Our inverter port guide details what each RJ45 socket carries and why the Console port stays free for a second reader.
Option 3: a permanent web dashboard on your own network
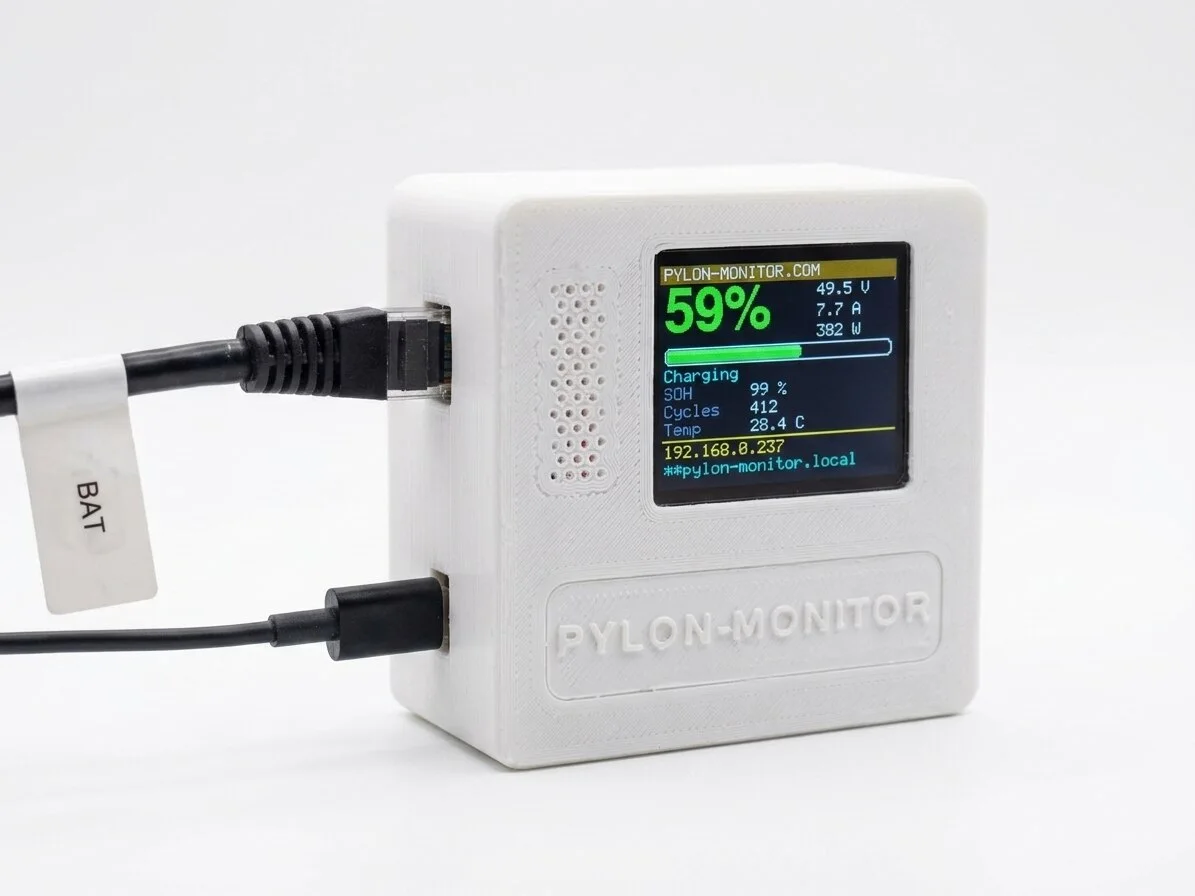
The third option is a small device that stays plugged into the Console port and serves the data as a web page on your network. It is not a viewer you launch, it is a viewer that is always there. Open a browser on any phone or laptop in the house, type the device's local address, and the current state of every battery in the stack is on screen. Nothing to install, no account needed.
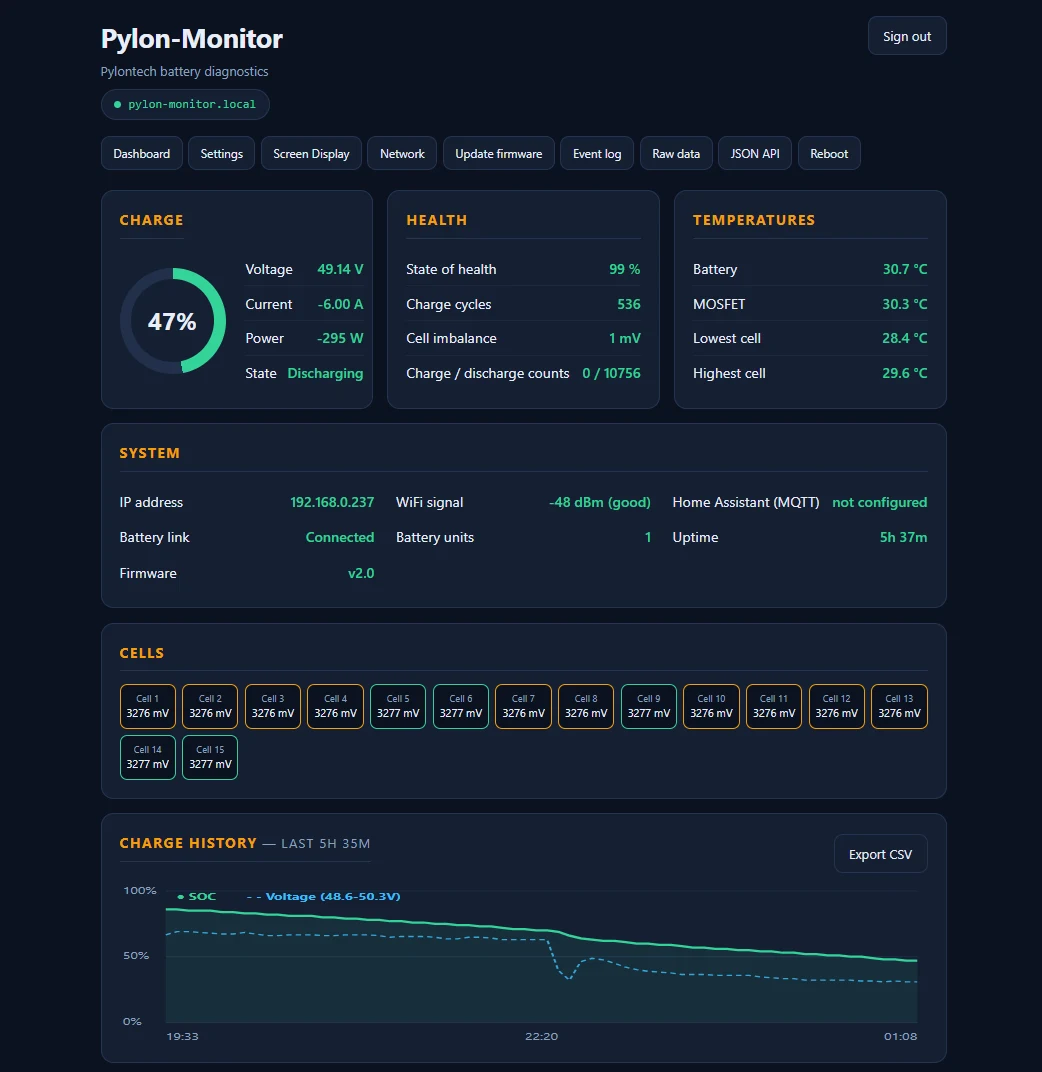
That is Pylon-Monitor's whole job, and the screenshot above is the real interface. You can go through every screen here before deciding whether it suits you.
Because it reads the Console port, it sees the detail the inverter link cannot carry: SOC, SOH, cycles and temperatures for each module, across up to 16 chained batteries, plus every cell voltage. Because it is permanent, it can do what a laptop session cannot: keep a history and raise an alarm when a threshold is crossed while nobody is looking. If you also want to see it from outside the house, an optional free online dashboard keeps up to three years of history, cell by cell.
Option 4: build your own viewer on the JSON API
If none of the above suits you, build your own. Any device that exposes the battery state as structured data lets you display it however you want. Pylon-Monitor answers GET /api.json on its local IP address with the full battery state in JSON: SOC, SOH, voltage, current, power, every cell voltage, temperatures and alarms, with no cloud in between and no API quota.
From there, a Grafana panel, a Node-RED flow, a tablet on the wall or a five-line shell script are all valid viewers. The integrations guide shows the same endpoint feeding Jeedom, Node-RED, Domoticz, openHAB and Grafana. If you use Home Assistant, MQTT auto-discovery gives you eleven sensors without a line of YAML.
Every Pylontech viewer side by side
| Viewer | Reads | Per cell & per module | Always on | History & alarms |
|---|---|---|---|---|
| PYLON Console / BatteryView | Console (RS-232) | Yes | No, laptop session | No |
| Inverter screen / app | CAN or RS485 | No, whole stack as one | Yes | Partly, depends on the inverter |
| Permanent web dashboard | Console (RS-232) | Yes | Yes | Yes |
| Your own, via the JSON API | Console (RS-232) | Yes | Yes | Whatever you build |
Which viewer should you use?
- You check the battery once a year and that suits you. Use PYLON Console on a laptop. It is free and shows everything. Really, do not buy hardware for that.
- You only want to know whether it is charging. Your inverter's app already does it. Nothing to add.
- You want to catch a problem before it becomes one. You need something permanent. A cell spread that creeps up over several weeks is invisible to a yearly check, and it is the earliest warning you will get. What to watch is explained here.
- You want the data in your own system. Take the JSON/MQTT route and display it wherever your home automation already lives.
Frequently asked questions
- Is there an official Pylontech viewer app?
- Pylontech supplies Windows software — usually called PYLON Console, sometimes distributed as BatteryView — which reads the battery through its Console (RS-232) port using an RJ45-to-serial adapter. It is free and shows the full data set, but it only works while a laptop is physically connected: it keeps no history and raises no alerts.
- Why does my inverter show less battery data than PYLON Console?
- Because it reads a different port. The inverter uses the CAN or RS485 link, which is a control protocol that deliberately presents the whole battery stack as one virtual battery. Per-module SOH, individual cell voltages and per-module temperatures are never sent over that link. The Console (RS-232) port is the one that carries them.
- Can I view Pylontech battery data on my phone?
- Yes, if something is reading the battery permanently and serving the data on your network. A device plugged into the Console port can present a web dashboard reachable from any phone browser on the same WiFi, with no app to install. Your inverter's own app may also show a limited view over its CAN/RS485 link.
- Do I need internet or a cloud account to view my Pylontech battery?
- No. Reading the Console port happens entirely on your local network. Pylon-Monitor's dashboard and its /api.json endpoint both work with the internet disconnected — there is no cloud service, account or subscription in the path.
Pylon-Monitor is the viewer that never switches off: a live web dashboard on your own network, a screen on the device itself, and a JSON API for everything else. Cloud optional, no subscription.
Order now — €59 One-time purchase, €59 total — no VAT, no subscription.